# What is TradingLab?
TradingLab has one goal. To make you a better trader. Whether you are a brand new trader, a trader with little experience, or an expert, TradingLab has the goal of helping you dominate the market.
We create tools to automate traders' technical analysis while simultaneously giving them a leading edge on the market. Traders can access these tools through Meta Trader 5, where the TradingLab Indicator can be applied.
TradingLab hybrid intelligent tools work on every timeframe in Meta Trader. They will also work on any market with sufficient volume (including stocks, forex, crypto, indices, futures, etc)
TradingLab has an entire trading community that can be found in Discord. The TradingLab Discord is a HUB for traders of all markets, trading types, and strategies. Within the TradingLab Discord server, you can talk to other like-minded traders, learn Pro Traders' strategies, follow Pro traders' callouts, and much more.
# Join The TradingLab Discord
Discord is a free instant-messaging platform for participating in communities. Below you will find the basics on how to create a free Discord account and how to join the community.
{% hint style="info" %}
This is a platform where we host our community alerts and where you can talk to other like-minded traders about their strategies using the indicator.
{% endhint %}
### Create A Free Discord Account
To create a discord account go to the [Discord website](https://discord.com/) and download the Discord app (or open it from the browser) and enter your desired username.
## Joining The Discord
When you first join our server, you won't be able to see anything besides our verify and support channel. In order to see the rest of the public channels, you must verify your account. If you haven't already joined the server, [click here.](https://discord.gg/UWHQRqkc4m)
{% hint style="danger" %}
Please note: If you are using a VPN you will not be able to verify
{% endhint %}
If you have problems verifying, DM TradingLab or one of the mods and they will sort everything out.
## Premium Channels
We offer premium channels to members that want the full TradingLab experience. In these channels you can get private calls with TradingLab, TradingLab's personal trades, government trade alerts, trading patterns, trading knowledge, and SO MUCH MORE. If you are interested in seeing the features that come with the Pro or Premium channels, click the "upgrade" channel to learn more.
If you are interested in getting access to these channels, you can do so [here.](https://tradinglab.ai/premium/)

# How To Install The Indicator on MetaTrader 5 (Windows)
{% hint style="danger" %}
WINDOWS 11 USERS PLEASE READ: If you are on Windows 11 that is not version 22621 and above you will need to update your Windows. The indicator will NOT work unless your Windows version is 22621 and above. To check your version type, search for "System Information" in the windows search bar and look for a screen like this:
{% endhint %}
### Step 1:
First, purchase the indicator on [tradinglab.ai](https://tradinglab.ai/test/) and sign up for the indicator subscription.
{% hint style="info" %}
Note: Make sure to re-enter your email correctly during the sign up process
{% endhint %}
{% hint style="danger" %}
Check your inbox, spam, and promotions folders in your email for invite link.
{% endhint %}
### Step 2
As of now, the indicator is only available on Meta Trader. Please note that the indicator will only work with Meta Trader 5, it will **NOT** work with Meta Trader 4.
Download metatrader 5 here:
Once installed, right-click on the MT5 shortcut on your desktop and click "Open file location". Copy the 4755 files below into this folder.
{% file src="/files/BfTwom9VetsxuEbEFnhJ" %}
### Step 3:
Once you have downloaded Meta Trader. Go to the TradingLab Discord.[^1] Once in the Discord, go to the channel called "Private-Indicator". This channel will contain the indicator installer. Download that file to your computer.
{% hint style="warning" %}
Note: Sometimes windows security/antivirus software will give you trouble when trying to install exe files. If you are having issues downloading the exe file see the [Troubleshooting](#troubleshooting) section at the bottom of this page.
{% endhint %}
### Step 4:
After downloading the exe installer file, run it on your computer.
{% hint style="danger" %}
Note: You can only install this indicator on **ONE** computer per purchase.
{% endhint %}
{% hint style="warning" %}
Note: When running the exe you might have to click on "More info" and then "Run anyway". See the [Troubleshooting](#troubleshooting) section at the bottom of this page for more info.
{% endhint %}
Next, agree to the licensing terms of use
Click "Next"
Lastly, make sure MetaTrader is closed and press "Install"
### Step 5:
Now that you have the indicator files installed on your computer, open MetaTrader 5 and go to "Tools -> Options"
Go to the "Expert Advisors Tab" and check the box that says "Allow DLL Imports"
### Step 6:
Close out of the options window and go to the left side of your screen to the "Navigator" window. Expand the "Indicators" icon. Under "Indicators" drag the TradingLab indicator icon to your chart.
{% hint style="info" %}
Note: If you can't see the navigator window, go to "View->Navigator" and click on this icon to get this window to appear on the left side of your screen
{% endhint %}
### Step 7:
Upon dragging the indicator to your chart, a window will appear. Make sure you check "Allow DLL Imports".
Go to the "Inputs" tab and under "email" double click the grey input box and type in the email that you signed with on tradinglab.ai.
Press OK and now the indicator should be added to your chart.
**Congrats, you have successfully installed the indicator!** :tada:
### Step 8:
#### Changing Between Ticker Symbols
If you want to change ticker symbols, make sure to drag the new ticker on the chart with the indicator already on it.
The Correct way to add a new ticker to your chart:
Do **NOT** do this:
#### Want your chart to look clean like the one above?
Follow this guide [here](https://docs.tradinglab.ai/how-to/how-to-clean-up-your-meta-trader-5-chart)
## Troubleshooting:
Exe files allow us to add custom features to our MetaTrader 5 indicator file. In certain situations, windows can get mad at you that you're trying to install a exe from the internet. If your browser gives you a warning message when trying to download the file, click on the down arrow and click on "Keep".
When trying to run the exe file, if you see the following screen:
Click on "More Info". Then click "Run Anyway"
If you are still having issues downloading or running the exe file, you will have to temporarily turn off your antivirus and then turn it back on after you've downloaded and ran the exe file.
### Step 1:
Open windows security by searching for it
Click on "Virus & Threat Protection"
### Step 2:
Click on "Manage settings"
### Step 3:
Toggle off "Real-time protection"
### Step 4:
Now retry downloading the exe file by following the earlier steps in [step 3](#step-3). After running the exe to the MetaTrader 5 data files, feel free to re-enable "Real-time protection" and your anti-virus after the installation is finished
{% hint style="info" %}
If you are having trouble installing the indicator. Feel free to email our support team at or join our [discord](https://discord.gg/UWHQRqkc4m) to create a support ticket they will kindly help you with the installation process.
{% endhint %}
[^1]:
# How To Install The Indicator on MetaTrader 5 (Mac)
### Step 1:
First, purchase the indicator on [tradinglab.ai](https://tradinglab.ai/test/) and sign up for the indicator subscription.
{% hint style="info" %}
Note: Make sure to re-enter your email correctly during the sign up process
{% endhint %}
{% hint style="danger" %}
Please check your inbox, spam, and promotions folders in your email for invite link.
{% endhint %}
### Step 2
As of now, the indicator is only available on Meta Trader. Please note that the indicator will only work with Meta Trader 5, it will **NOT** work with Meta Trader 4.
{% file src="/files/YhwoJk9qbsvw5EWV4UVP" %}
### Step 3:
Once you have downloaded Meta Trader. Go to the TradingLab [Discord.](https://discord.gg/UWHQRqkc4m) Once in the Discord, go to the channel called "Private-Indicator". This channel will contain the indicator installer. Download that file to your computer. i
{% hint style="danger" %}
Note: You can only install this indicator on **ONE** computer per purchase.
{% endhint %}
### Step 4:
After downloading the zip file, move it from your downloads folder to your desktop and double click to unzip the folder.
### Step 5:
Open MetaTrader 5 and go to "File -> Open Data Folder".
A new window should appear that looks like this:
### Step 6:
Click on the folder on the left hand side of the screen that says "My Mac Desktop".
Find the folder you unzipped in step 4 and double-click to open the folder. Once this folder is open it should look similar to this:
### Step 7:
Right click and copy the .ex5 indicator file.
{% hint style="warning" %}
Note: To right click on mac inside of this window you may have to use Control+Click or double tap with two fingers on the track pad
{% endhint %}
Now we need to navigate to the folder "MQL5->Indicators" to paste the file. Below is a gif of the whole process:
### Step 8:
{% hint style="info" %}
Note: At any point in time if you get lost in the folders here, just close out of this window and repeat step 5 to open the data folders again
{% endhint %}
Now reopen the folder on your desktop and right-click and copy the .dll file. We then need to paste it into the folder "MQL5->Libraries". Below is a gif of the whole process:
After pasting the dll file, close out of this window. Then close out of MetaTrader 5.
### Step 9:
Now that you have the indicator files installed on your computer, open MetaTrader 5 and go to "Tools -> Options"
Go to the "Expert Advisors Tab" and check the box that says "Allow DLL Imports"
### Step 10:
Close out of the options window and go to the left side of your screen to the "Navigator" window. Expand the "Indicators" icon. Under "Indicators" drag the TradingLab indicator icon to your chart.
{% hint style="info" %}
Note: If you can't see the navigator window, go to "View->Navigator" and click on this icon to get this window to appear on the left side of your screen
{% endhint %}
### Step 11:
Upon dragging the indicator to your chart, a window will appear. Make sure you check "Allow DLL Imports".
Go to the "Inputs" tab and under "email" double click the grey input box and type in the email that you signed with on tradinglab.ai.
Press OK and now the indicator should be added to your chart.
**Congrats, you have successfully installed the indicator!** :tada:
### Step 12:
#### Changing Between Ticker Symbols
If you want to change ticker symbols, make sure to drag the new ticker on the chart with the indicator already on it.
The Correct way to add a new ticker to your chart:
Do **NOT** do this:
#### Want your chart to look clean like the one above?
Follow this guide [here](https://docs.tradinglab.ai/how-to/how-to-clean-up-your-meta-trader-5-chart)
{% hint style="info" %}
If you are having trouble installing the indicator. Feel free to email our support team at or join our[ discord](https://discord.gg/UWHQRqkc4m) to create a support ticket they will kindly help you with the installation process..
{% endhint %}
# How To Clean Up Your Meta Trader 5 Chart
The original charting layout for Meta Trader is pretty ugly, and to be honest, it's pretty hard to read. Luckily for you, I already made a super clean chart template you can use.
### Step 1
Download this chart Layout File
{% file src="/files/OEIlo5ODDHs992jh929d" %}
{% hint style="warning" %}
MAC USERS: Make sure you save this tpl file to your Desktop. When loading the template you'll need to find it under "My Mac Desktop"
{% endhint %}
### Step 2
Right Click on your chart in Meta Trader > Templates > Load Templates
### Step 3
Drag the chart layout file you downloaded earlier into this folder
### Step 4
Click "open" and your chart should look clean :)
{% hint style="info" %}
If your chart ever goes back to the original look, just right-click on your chart > templates > load template > then open the "TradingLab Chart Template" again.
{% endhint %}
### Step 5
Once you changed your chart layout, you may have to add the indicator again.
# How To Add Stocks & Crypto To Meta Trader
When first setting up Meta Trader you will quickly notice you do not have access to stock and crypto charts. To do this, you just have to connect your broker to MT5 and you'll then have access to those tickers.
### Step 1
In order to add crypto or stocks to your ticker list, you'll need to open a new broker or connect your current broker to Meta Trader. Go to the Navigator Tool Menu on the left > Right Click "Accounts" > Open an Account.
### Step 2
This will pull up a pop-up window. Type in your current crypto or stock broker and see if MT5 allows it. Meta Trader has a huge selection of popular brokers so yours will probably be there.
### Step 3
If you are having trouble finding your broker or do not currently have a broker. You can use "IC Markets" which allows both stocks & crypto. Make sure to click the one labeled **"IC Markets (EU) Ltd"**
You can set it up directly on MT5 super fast (takes 5 seconds). You don't even have to use them as an "actual" broker. You can just set up a demo account with fake money so you can just see stock/crypto tickers on Meta Trader.
### Step 4
Once you have your demo account created, you can go to the tickers in the top left and type in any stock or crypto ticker you desire.
{% hint style="info" %}
Note: If a specific ticker you're interested in is not showing up, you will have to try a different broker. A simple google search will tell you what brokers have what tickers available.
{% endhint %}
# How To Use The Indicator
### Symbols
Unfortunately, Meta Trader doesn't allow text boxes for strong buy, strong sell signals, etc. So we had to use symbols instead. We tried choosing the ones that made the most sense. It may seem a little confusing when you first look at it, but after 5 minutes of using it, you get the hang of it.
Strong Long
Long
Long Exit
Strong Short
Short
Short Exit
Long Retracement
Short Retracement
Take Profit 1
Take Profit 2
### Symbol Definitions
* **Strong Long** - A strong long is an entry signal to enter a long trade. It is more "confirmed" than a "long".
* **Long** - A long is an entry signal to enter a long trade.
* **Long Exit** - Will show up if the trade long trade ends up being a losing trade and notifies you to exit the trade.
* **Strong Short** - A strong short is an entry signal to enter a short trade. It is more "confirmed" than a "short".
* **Short** - A short is an entry signal to enter a short trade.
* **Short Exit** - Will show up if the short trade ends up being a losing trade and notifies you to exit the trade.
* **Long Retracement** - Will show if the low of the candle reaches the entry value of the trade.
* **Short Retracement** - Will show if the high of the candle reaches the entry value of the trade.
* **Take Profit 1** - Will show if you are meant to take partial take profit.
* **Take profit 2** - Will show if you are meant to close out the entire trade.
### Enabling/Disabling Tools & Changing Settings
In order to change the settings of the indicator or enable/disable certain features, double-click on any of the icons on the chart. This will pull up a settings window. Here you can change values, enable features, and set the indicator experience to however you prefer.
### Changing Between Ticker Symbols
If you want to change ticker symbols, make sure to drag the new ticker on the chart with the indicator already on it.
The Correct way to add a new ticker to your chart:
Do **NOT** do this:
# How To Set Alerts
Alerts can be created to trigger on any user set condition, like crosses between two indicators, price entering or exiting a channel...etc. Users can be notified when the condition is triggered via desktop notifications, emails, etc.
### Create An Alert
When adding the indicator to the chart, the default alerts come pre-enabled, which basically just pops up a window and says the action on whatever chart is open.
To add the other types of alerts, you'll need to activate them in the settings menu, and then configure the push notifications / email / sound alerts in the settings menu.
Go to the settings of the indicator **→** Scroll down till you see "Alert Settings". Enable whatever alerts you prefer to use.
{% hint style="warning" %}
**Please note:** In order for you to receive alerts, your chart must be open.
If you would like to be able to close your chart and still get alerts, you have to set up [Virtual Hosting. ](https://www.metatrader5.com/en/trading-platform/vps)
{% endhint %}
### Email Alerts
#### 1. Navigate to **Tools → Options**.
#### 2. First, check the option “**Enable email notification**“
#### 3. Enter the required details
**SMTP Server:** Enter the SMTP server host (smtp.gmail.com)
**SMTP Login:** Enter the SMTP username (your email address)
**SMTP Password:** Enter SMTP password (your email password)
**From:** Enter the email from which you would like to send the email notifications.
**To:** The name you want the alerts to come from
{% hint style="info" %}
If you are using Gmail you may have to use "456" as the port number. Example: "smtp.gmail.com:456". If you are using something other than Gmail, you will have to look up what port number to use.
{% endhint %}
#### Creating SMTP password:
When setting up your email password, you have to create an "app password" through Gmail so MT5 can login to your Gmail. This a Gmail specific tutorial. If you are using a different email provider, you will have to figure out how to create an "app password" on their platform.
1. Go to your [Google Account](https://myaccount.google.com/).
2. Select **Security**.
3. Under "Signing in to Google," select **App Passwords**. You may need to sign in. If you don’t have this option, it might be because:
1. 2-Step Verification is not set up for your account.
2. 2-Step Verification is only set up for security keys.
3. Your account is through work, school, or other organization.
4. You turned on Advanced Protection.
4. At the bottom, choose **Select app** and choose the app you using  **Select device** and choose the device you’re using  **Generate**.
5. Follow the instructions to enter the App Password. The App Password is the 16-character code in the yellow bar on your device.
6. Tap **Done**.
#### 4. Finally, click on **SAVE**.
{% hint style="success" %}
Once the configured alerts condition becomes true, or an event happens, you will receive the same alert through the configured SMTP server on the “TO” email address.
{% endhint %}
### Mobile Alerts
Mobile notifications also need to be enabled in the *Options*. They also require one additional step.
In *Tools→Options→Notifications*, you need to tick *Enable Push Notifications* and insert your *MetaQuotes ID*.
You will need to download and install MetaTrader app for your phone, either Android or iOS.
Once MetaTrader mobile app is installed, you can retrieve the *MetaQuotes ID* from it as instructed in the *Notifications* tab.
Once configured, you can send a test to check if it works.
To start receiving alerts to your phone using MetaTrader follow these instructions;
* Download the MT5 app on your phone.
* Open the app on your mobile and go to the messages header. Look for your eight character ID number.
* Open your MetaTrader charts on your desktop.
* Select “Tools” > “Options and then “Notifications”.
* Enable the checkbox for “Enable push notifications”.
* Enter your eight character ID that you got from your mobile app.
* Hit the test button. This should send a test alert to your phone to make sure it is working.
### Alert Notifications
Alert notifications are enabled by default. However, if you wish to change the sound used for these alerts, you can do so in the *Events* tab.
# How To Manage Your Subscription
If you are interested in upgrading, canceling, or managing your subscription in general, you can do all of that in our [account management portal.](https://tradinglab.ai/manage-account/)
{% hint style="info" %}
If you are having trouble receiving your OTP password, try checking your spam, junk, and promotional folders. If you still can't find it, feel free to email our team at and we'd be happy to help!
{% endhint %}
# How To Update The Indicator (Windows)
### Step 1:
Go to the TradingLab [Discord.](https://discord.com/channels/961751592737067028/1005654418424860802) Once in the Discord, go to the channel called "Private-Indicator". This channel will contain the latest version of the indicator installer. Download that file to your computer.
{% hint style="warning" %}
Note: Sometimes windows security/antivirus software will give you trouble when trying to install exe files. If you are having issues downloading the exe file see the [Troubleshooting](https://docs.tradinglab.ai/how-to/how-to-install-the-indicator-on-metatrader-5-windows#troubleshooting) section from the first time installation instructions.
{% endhint %}
### Step 2:
After downloading the exe installer file, run it on your computer.
{% hint style="warning" %}
Note: When running the exe you might have to click on "More info" and then "Run anyway". See the [Troubleshooting](https://docs.tradinglab.ai/how-to/how-to-install-the-indicator-on-metatrader-5-windows#troubleshooting) section from the first time installation instructions for more info.
{% endhint %}
Next, agree to the licensing terms of use
Click "Next"
Lastly, make sure MetaTrader is closed and press "Install"
### Step 3:
Close out of the options window and go to the left side of your screen to the "Navigator" window. Expand the "Indicators" icon. Under "Indicators", delete the previous version of the indicator and drag the latest version of the TradingLab indicator icon to your chart.
{% hint style="info" %}
Note: If you can't see the navigator window, go to "View->Navigator" and click on this icon to get this window to appear on the left side of your screen
{% endhint %}
### Step 4:
Upon dragging the indicator to your chart, a window will appear. Make sure you check "Allow DLL Imports".
Go to the "Inputs" tab and under "email" double click the grey input box and type in the email that you signed with on tradinglab.ai.
Press OK and now the new updated indicator should be added to your chart.
**Congrats, you have successfully updated the indicator!** :tada:
{% hint style="info" %}
If you are having trouble installing the indicator. Feel free to email our support team at or join our [discord](https://discord.gg/CZnSXG7ZGf) to create a support ticket they will kindly help you with the installation process.
{% endhint %}
# How To Update The Indicator (Mac)
### Step 1:
Go to the TradingLab [Discord.](https://discord.com/channels/961751592737067028/1005654418424860802) Once in the Discord, go to the channel called "Private-Indicator". This channel will contain the latest version of the indicator files zip. Download that file to your computer.
### Step 2:
After downloading the zip file, move it from your downloads folder to your desktop and double click to unzip the folder.
### Step 3:
Open MetaTrader 5 and go to "File -> Open Data Folder".
A new window should appear that looks like this:
### Step 4:
Click on the folder on the left hand side of the screen that says "My Mac Desktop".
Find the folder you unzipped in step 4 and double-click to open the folder. Once this folder is open it should look similar to this:
### Step 5:
Right click and copy the .ex5 indicator file.
{% hint style="warning" %}
Note: To right click on mac inside of this window you may have to use Control+Click or double tap with two fingers on the track pad
{% endhint %}
Now we need to navigate to the folder "MQL5->Indicators" to paste the file. After pasting this file we need to delete the previous version of the indicator. Below is a gif of the whole process:
### Step 6:
Now that you have the indicator files installed on your computer, open MetaTrader 5 and go to "Tools -> Options"
Go to the "Expert Advisors Tab" and make sure the box that says "Allow DLL Imports" is checked
### Step 7:
Close out of the options window and go to the left side of your screen to the "Navigator" window. Expand the "Indicators" icon. Under "Indicators" drag the TradingLab indicator icon to your chart.
{% hint style="info" %}
Note: If you can't see the navigator window, go to "View->Navigator" and click on this icon to get this window to appear on the left side of your screen
{% endhint %}
### Step 8:
Upon dragging the indicator to your chart, a window will appear. Make sure you check "Allow DLL Imports".
Go to the "Inputs" tab and under "email" double click the grey input box and type in the email that you signed with on tradinglab.ai.
Press OK and now the updated indicator should be added to your chart.
**Congrats, you have successfully updated the indicator!** :tada:
{% hint style="info" %}
If you are having trouble installing the indicator. Feel free to email our support team at or join our [discord](https://discord.gg/CZnSXG7ZGf) to create a support ticket they will kindly help you with the installation process.
{% endhint %}
# Common Problems
## How To Fix The Indicator Now Showing Up On Your Chart
### Step 1:
Make sure you signed up on [tradinglab.ai](https://tradinglab.ai/). You should have received an email if the sign up process was successful
### Step 2:
*If you did not sign up using "manage my account" on tradinglab.ai, then ignore this section.*
{% hint style="warning" %}
If you are a returning customer who used our TradingView indicator in the past and you signed up using “manage my account”, please make a ticket in our [discord ](https://discord.gg/CZnSXG7ZGf)and clearly state you are a returning customer and you signed up using “manage my account”. We will change something in the system to get you up and running.
{% endhint %}
### Step 3:
Indicator gives you a "invalid email" error message. There are multiple reasons for why you are receiving this error.
#### Fix 1: Don't add the indicator to one chart multiple times
Do not drag the indicator multiple times onto one chart, this will cause issues. Go to Charts->Indicator list
Make sure there is only one "Tradinglab Indicator" here :white\_check\_mark:
Avoid this :x:
Avoid this!
#### Fix 2: You are misspelling your email
Go to the "Inputs" tab and under "email" double click the grey input box and type in the email that you signed with on tradinglab.ai. Make sure to type it in correctly.
#### Fix 3: Make sure you are adding the indicator to your chart properly
If you want to change ticker symbols, make sure to drag the new ticker on the chart with the indicator already on it.
The Correct way to add a new ticker to your chart:
Do **NOT** do this:
#### Fix 4: You are on an outdated version of Windows 11
*If you are on Windows 10 or Mac, feel free to skip this step.*
You may see a "access violation error message" that looks like this:
This error message usually means that you are on Windows 11 that is not version 22621 and above you will need to update your Windows. The indicator will NOT work unless your Windows version is 22621 and above. To check your version type, search for "System Information" in the windows search bar and look for a screen like this
### Step 4:
If you signed up correctly on tradinglab.ai, you followed the instruction guides for [mac](https://docs.tradinglab.ai/how-to/how-to-install-the-indicator-on-metatrader-5-mac) and [windows](https://docs.tradinglab.ai/how-to/how-to-install-the-indicator-on-metatrader-5-windows), you are not mistyping your email, you are adding it to your chart properly, and you are not on an outdated version of Windows 11, then there is most likely going to be an error message that shows up "Experts" Tab in the bottom right of your MetaTrader 5.
If this error message says anything about a ".dll" make sure dll imports are enabled. You can do that by doing the following: open MetaTrader 5 and go to "Tools -> Options"
Go to the "Expert Advisors Tab" and check the box that says "Allow DLL Imports"
Upon dragging the indicator to your chart, a window will appear. Make sure you check "Allow DLL Imports".
### Step 5:
If you are still having issues, please join our [discord](https://discord.gg/CZnSXG7ZGf) and create a support ticket. For the fastest response time include the following information in the ticket:
* Your email
* A screenshot of your windows version by searching for "System Information" in the bottom left of windows
* A screenshot of "Chart->Indicator List"
* A screenshot of the email you inputted into the indicator settings. You can find these in “Chart->Indicator list->Properties”
* A screenshot of your "Experts" tab in the bottom right
## Price data not showing up on chart
For some reason, sometimes MT5 will do this:
It's some sort of bug where the candles are all the way on the left side of the screen and you can't scroll through price history. We don't know why this happens but we figured out a fix for it.
#### Fix: Switch brokers
In the original tutorial, we tell you to make a demo broker account with ICmarkets. For some reason, some users will get this bug above when using ICmarkets. To fix this problem, try switching brokers.
Another easy-to-install broker is called "**Pepperstone**". You can set up a demo account directly on MT5 very easily. This should fix the problem above.
{% hint style="info" %}
If for some reason you are still having this issue, try using a VPN. I've heard this will solve the issue as well.
{% endhint %}
### Symbols not showing up
If your chart looks like the above image, here is the fix.
#### Step 1: Right click your time in the bottom right and select "adjust date and time:
#### Step 2: Select Language and Region
#### Step 3: Select Administrative Language Settings
#### Step 4: Select "change system local" then uncheck "Beta"
Once you have done that, delete the indicator from your chart, restart MT5, then add the indicator again. This should fix the issue.
# How To Fix Access Violation error (Windows)
## What is this error?
This is a rare error message that will show up in your "Experts" tab on mt5. This error affects a very small amount of users (usually only Windows 11 users). Typically this error happens because of one or more of these reasons:
* You are using a special version of MT5 not the official one
* Your Windows is not fully up to date
* Your latest version of MT5 is bugged and you need to rollback to a previous version
### Make sure your windows is updated to the most recent version:
If you are on Windows 11 that is not version 22621 and above you will need to update your Windows. Please make sure your Windows version is up to date.
### Make sure you are using the official MT5 and not a special version:
The indicator can have issues when using a special MT5 version from a 3rd party. We recommend using the official version which you can download here
### Rollback your MT5 version:
If you are on the latest version of Windows and you are using the official version of MT5 and you are still having this error, below is a walkthrough on how fix this.
Download MT5 here:
Step 1:
Once the indicator is installed, download the 5430 zip files. Right click on the file and click “EXTRACT”
Once extracted, it will look like this:
Highlight and click copy on ALL THREE of those files.
Once you’ve clicked copy
· Go back to your desktop
· Find the MT5 Icon
· Right click and then click on “Open File Location”
It should now look like this:
Right click and paste the 3 files you just copied and overwrite them into this folder.
When you open MT5 and get this prompt:
IMPORTANT: Click NO every time it should come up.
This message may come up in MT5 at some point. Click LATER every time
MT5 should not update and the indicator will function as usual.
# How To Download The Free Indicator
### Step 1: Install Meta Trader 5
As of now, the indicator is only available on Meta Trader. If you do not have Meta Trader 5 Installed, you can do so [here](https://www.metatrader5.com/en/download). Please note that the indicator will only work with Meta Trader 5, it will **NOT** work with Meta Trader 4.
### Step 2: Download The indicator
{% file src="/files/X0NdHk3bn6tDn4B8x33r" %}
### Step 3: Install the Indicator on Meta Trader 5
Open MT5 --> File --> Open Data Folder
Next Click the "MQL5" Folder --> Indicators --> Then drag the file (TradingLab ABC Indicator) in this folder.
### Step 4: Restart Meta Trader 5
Once you have added the indicator to the "indicator" folder, you need to restart Meta Trader 5.
### Step 5: Add the Indicator to your chart
You should now have the indicator added to your Meta Trader. To add it to your chart, simply open the Indicators folder on the left, and drag the indicator on your chart.
### You're Done!
* If you would like to clean up your chart, like the one in the GIF and images above. Follow this [guide.](https://docs.tradinglab.ai/how-to/how-to-clean-up-your-meta-trader-5-chart)
* If you would like to add crypto or stocks to Meta Trader 5, follow this [guide.](https://docs.tradinglab.ai/how-to/how-to-add-stocks-and-crypto-to-meta-trader)
Enjoy the indicator :)
# Buy/Sell Signals
If you haven't figured it out by now, you should NOT follow the buy/sell signals blindly. I get messages every single day saying "The indicator isn't giving good signals, blah blah blah". The indicator isn't just a simple "follow the buy/sell signals" indicator. You have to incorporate many other trading techniques within the indicator's arsenal in order to make it successful.
### The Strategy
What I personally like doing is going on a very large timeframe to see the general direction of the market. The weekly or daily time frame will suffice.
Once you are on this higher time frame, you should be checking all the tools that you have at your disposal. What's the[ key metrics table ](https://docs.tradinglab.ai/indicator-strategies/key-metrics-table)doing? What's the [breakout probability](https://docs.tradinglab.ai/indicator-strategies/breakout-probability-strategy) tool say? Is price near a [support or resistance](https://docs.tradinglab.ai/trading-tips/support-and-resistances)? Are there [fair value gaps](https://docs.tradinglab.ai/indicator-strategies/fair-value-gap-strategy) nearby? Are there any [Divergences](https://docs.tradinglab.ai/trading-tips/divergences) on the chart?
These are just a few examples of what you should be looking for on these larger time frames. I have already written many detailed tutorials on each tool. I would deeply suggest learning about each tool first before you start trading with the indicator.
Once you know the general direction of the chart on a higher timeframe by using the tools listed above, you can then switch to a lower timeframe like the 15m, 30m, 1hr, 3hr, and follow the corresponding buy/sell signals there.
So if there are bullish fair value gaps, positive %'s on the breakout probability tool, and bullish metrics on the key metrics table, you would take **long trades only.**
if there are bearish fair value gaps, negative %'s on the breakout probability tool, and negative metrics on the key metrics table, you would take **short trades only.**
Anything in the middle is just noise and is just a ranging market (which we want to avoid).
Hopefully this clears some things up on how you should be using the buy/sell signals.
# Smart Money Concepts
The TradingLab Smart Money Concepts toolkit includes a wide variety of price action-related tools; including smart money-related features, automated imbalances, and order blocks.
{% embed url="" %}
{% content-ref url="/pages/RlYiaFU4qIupLqZSulU8" %}
[Market Structure](/indicator-strategies/smart-money-concepts/market-structure)
{% endcontent-ref %}
{% content-ref url="/pages/GnoI89tta9nmapfao6rX" %}
[Order Blocks](/indicator-strategies/smart-money-concepts/order-blocks)
{% endcontent-ref %}
{% content-ref url="/pages/PptqXJHnETUrXBbi3C5E" %}
[Fair Value Gaps](/indicator-strategies/smart-money-concepts/fair-value-gaps)
{% endcontent-ref %}
{% content-ref url="/pages/AI8T6KmrRELOCXp78pKv" %}
[Liquidity Grabs](/indicator-strategies/smart-money-concepts/liquidity-grabs)
{% endcontent-ref %}
{% content-ref url="/pages/hLR5Jk9DiqvUkctSrQpF" %}
[High & Lows](/indicator-strategies/smart-money-concepts/high-and-lows)
{% endcontent-ref %}
{% content-ref url="/pages/9BRqWIyQntOcoL2WDxRC" %}
[Full Strategy](/indicator-strategies/smart-money-concepts/full-strategy)
{% endcontent-ref %}
# Market Structure
Market structures are core concepts of the smart money concepts methodology. The TradingLab Smart Money Concepts toolkit automatically detects and highlights real-time market structures on the market, allowing for a wide variety of entry/exit signals.
### Types Of Market Structures
Market structures allow you to determine trend continuations as well as trend reversals in the market through two distinct structures:
* Change of Character (CHoCH)
* Break of Structure (BOS)
These are further described in the sub-sections below.
#### Change Of Character (CHoCH)
A change of character (CHoCH), sometimes also referred to as "market structure shift" is characterized by price breaking a prior swing low during an uptrend (bullish CHoCH) or a prior swing high during a downtrend (bearish CHoCH), and thus indicates a potential market reversal.
#### Break Of Structure (BOS)
A BOS is characterized by price breaking a prior swing high during an uptrend (bullish BOS) thus forming a new higher high, or a prior swing low during a downtrend (bearish BOS) thus forming a new lower low. These structures occur after a CHoCH.
BOS's do not indicate reversals but continuations of a trend, as such it is common to observe successive BOS in a trend.
# Order Blocks
### What is an order block?
An **Order block is considered a market behavior that indicates the pile-up of orders from banks and institutions.** The central banks and financial institutions mainly drive the market. Hence, traders should try to follow what they do. The market starts ranging while building the order block, and most of the investing decisions take place at that time.
The market tends to make a sharp move on either side once the order block is completed. The key behind order blocks is that it includes what giant institutions are doing.
### How to use the order block feature
If you would like to learn some tips and tricks on using the order block feature, I made a full-on tutorial going over the tool. This is an absolute must if you want to take your trading to the next level.
{% embed url="" %}
# Fair Value Gaps
A Fair Value Gap (FVG) is just when price spikes up or down so fast, that buyers/sellers do not have enough time to counteract the movement. Which creates an imbalance in the market.
When the market has these imbalances, it will often want to return to this untested price and try to test it again. Most of the time, rejecting back to where it was previously.
You would measure this area by taking the candle's wick before the big spike & taking the candle's wick after the spike. This zone is the untested area (Fair Value Gap).
These fair value gaps can be used as entries and/or exits.
# Liquidity Grabs
Liquidity refers to the ability to find a counterpart to a trade.
For example, if you want to buy, you need somebody in the market willing to sell it at the price.
Big trades and institutional investors who need to fill big million-dollar orders must find liquidity areas in the market to complete their trade.
Stops are often considered to be critical for survival in a leveraged market.
A trader who does not include stops in his strategy will eventually face a condition of forced liquidation.
A majority of market participants are considered to be speculators who don’t enjoy the luxury of holding on to a losing trade for too long as their positions are leveraged.
Big and small traders often use stop and stop-loss orders to lock in their profits automatically.
Stop hunting is a common practice in the market and involves forcing market participants to leave their positions by driving the price to a level where traders have set up their stop-loss orders.
When too many stop losses are triggered at the same time, a high volatility scenario is created where some investors can find unique opportunities.
Such a practice is called liquidity grab which we discuss further in this guide.
# High & Lows
The TradingLab indicator will automatically display the previous highs & lows of the chart. These areas are where price needs to do a [liquidity grab](/indicator-strategies/smart-money-concepts/liquidity-grabs) in order for us to get a lot of momentum in our up-and-coming trade.
# Full Strategy
If you would like to see how the FULL smart money concepts strategy is performed, I have already made a video on how to use it.
{% embed url="" %}
This strategy has worked wonders for me. That's why I decided to share it with you guys. Enjoy :)
# Breakout Probability Strategy
This is probably one of the most overpowered tools I've made in my trading career. If used correctly, it's an absolute game changer. You really have to use it for yourself to see the power of this thing.
{% embed url="" %}
# Fair Value Gap Strategy
## What are Fair Value Gaps (FVG)?
A FVG is just when price spikes up or down so fast, that buyers/sellers do not have enough time to counteract the movement. Which creates an imbalance in the market.
When the market has these imbalances, it will often want to return to this untested price and try to test it again. Most of the time, rejecting back to where it was previously.
You would measure this area by taking the candle's wick before the big spike & taking the candle's wick after the spike. This zone is the untested area (Fair Value Gap).

Luckily for you, [our indicator](https://tradinglab.ai/) does all this for you automatically. Just go to the settings of the indicator and enable "Fair Value Gaps".

Our indicator will automatically place FVG's on your chart in real-time. It will also label them as bullish (green) or bearish (red).

## The Strategy
### Step 1: Support or Resistance
First things First, you want to find a key support or resistance. For this example we are going to be shorting, so we need to look for a major resistance. If you wanted to do a long trade, you would look for a support.
You can find a key resistance by just finding a recent swing high or by going on a higher timeframe (like the 1 hour) and looking for major levels of resistance. The stronger the resistance, the better.
So we went on the 1 hour time frame and found a major resistance, where price rejected multiple times previously.

### Step 2: False Breakout
The next step is we want to find a false breakout. A false breakout is just when price breaks a key support or resistance and starts acting like it's going to keep going, then ends up failing, and heads the opposite direction.

False breakouts are crucial because traders that would be going long on a potential breakout trade would be setting their stop losses right below their entry. If it ends up being a false breakout, price will then end up hitting all their stop losses adding fuel to the fire of the downwards momentum.

So, you want a false breakout to be made on your strong resistance/support that you plotted earlier. Here, the resistance barely got broken, but as long as it's a false breakout, it will work.

### Step 3: Identify Two Lower Lows
We want to find two lowers after the false breakout. This will confirm that prices wants to start heading downwards. The clearer the two lows are, the better.

Price ends up making two lower lows on our chart. Even though the two lower lows arent' "perfect" with a confusing candle wick in between, it will still work.
.png?alt=media\&token=6a5abdca-4c41-409f-9ef7-c27ad48dd839)
### Step 4: Find a Fair Value Gap
This next step is crucial. After price has made two lower lows, we will look for our short trade entry. We do this by finding a bearish fair value gap on the chart where price will likely return.
Make sure to enable your fair value gap tool on the indicator so you can easily spot them.
On the last low, we had two bearish Fair Value Gaps. Our entry point will be in the middle of the highest Fair Value Gap.

If there are multiple FVG's on the 2nd low, just plot your entry point on the highest FVG. Sometimes price will not reach it, and you'll miss out on the trade. It's alright, there will always be more trades. Aiming for the high FVG will give you the best risk/reward ratio.

#### Entry, Stop Loss, Take Profit
So Price hit the middle of our fair value gap, so we entered a short trade. You can set your stop loss at the recent swing high or right above the original strong resistance. I prefer using the swing high, as it has a better risk/reward ratio. You will get stopped out more, but I find it to perform better. Do your own testing and see what works best for you.

You will be setting your take profit where the original move started. Most of the time this area is pretty obvious.

You should also be taking partial profits (25%-50%) at key hesitation points in the chart for guaranteed profits. Price will not always make it to the original start of the low. Sometimes it will only go down to the last hesitation area and will proceed to go back up. It's good to take profits at these areas just in case price decides to do so.

As you can see price hit all three of our take profit areas and we made an absolute killing off this trade.

P.S I'm sorry if this article wasn't clearly written. I'm currently writing this at 4am. It's a pretty confusing trading topic, but hopefully, I described it pretty well. You can get way more advanced with this strategy by using FVGs as take profits, using divergences with the fakeouts, and so many other trading techniques.
Thought I would just cover the basics for now and give you a basic understanding of how this strategy works.
If you are more of a visual learner, I made a full YouTube video describing how to use this strategy.
{% embed url="" %}
# Machine Learning
### How it Works
In the recent 1.0.7 update, we released a machine learning feature to the baseline.
The baseline will track other popular indicator values in real-time (RSI, CCI, ADX, and some other popular indicators). It will scan all of those indicators and all of their values for the entire past chart history (looking at all of those data points from years of past data), and then find what price did at those specific values. Did it go up, go down, or move sideways?
The indicator will note that and essentially create a "map" of what price did at what indicator values. Which is this screenshot right here:
Once it creates that map, it will look at the current bar of where price currently is. We take the current values of those other popular indicators and look for the closest data points from past history compared to the present. So it will basically try to find data points from the past that look the closest to what it is currently.
It will then compare that to what price did back in past chart history with multiple instances. It will then compute the distance from every previous point, and then average out all those changes.
This essentially can give a great prediction of what price is likely to do based on the previous data values and observed trends.
The cool thing about this though is the more that this indicator runs and the more data it receives, the more accurate it's going to get in the future. Which is pretty cool in itself.
### Baseline
We completely redid the baseline for this new update. Essentially it works like this. The darker the green, the more the machine learning thinks the price will go up.
If its a lighter green, it still thinks it's going to up, but the probability is just a little less.
Same thing with the red. The darker the red, the more sure the machine learning thinks it's going to go down.
Then grey is basically consolidation.
### Trend Table
The trend table has a new "machine learning" metric. The value will update in real-time and will have a corresponding color depending on if it's bullish, bearish, or consolidating.
Dark Green => 75% and up
Green => 50% and up
Light Green => 25% and up
LightRed => -25% and below
Red => -50% and below
Dark Red => -75% and below
### How To Use
The new baseline can be used in a lot of different ways. I think it will be best used for confluences. For example, if there is a buy signal from the indicator, make sure the baseline agrees with the signal.
You can even go on larger time frames and check what color the baseline is on a larger timeframe. Once you know the color, you can then go on a lower timeframe and only follow signals correlating to that color.
Another way it can be used is for take profits. So for example, in the image below, the indicator gave us two long entries. The first one worked out great and we got both take profits. The second buy signal only gave us one take profit. After the first take profit was hit, the chart tanked and we ended up exiting for a loss.
If you look closely, the new machine learning baseline turned red right after the first take profit. which could be a great indication that the chart is about to fall and we should just take our profits there.
There are a lot of different fantastic ways we can use this indicator. I'm excited to see what we can find. The machine learning feature is only going to get better over time. Very exciting stuff.
### Video Tutorial:
{% embed url="" %}
# Key Metrics Table
The key metrics table is an essential tool to follow in order to make this indicator profitable. You should be using this tool as a guide when entering trades. There are a few key things to consider when trading in live markets to ensure you are entering quality trades while using the indicator.
### Trend
The trend is the overall direction of the market. You want this to replicate whatever type of trade you are doing. So if you want to take a long trade, the most optimal signal is "Strong long".
If you are shorting, you want to see "Strong Short" for the trend.
### Strength
Just like most indicators, the TradingLab indicator doesn't perform well in ranging/sideways markets. So, we only want to be entering markets that have lots of volatility and that are moving a lot.
In that case, we want the "strength" metric to be as high as possible. The higher, the better.
### Momentum
Momentum measures the velocity of price changes as opposed to the actual price levels themselves. You want this to match whatever style of trade you are taking.
"Bullish" for long trades, "Bearish" for short trades.
### Volatility
Volatility is the rate at which the price increases or decreases over a particular period. Considering we don't want to be trading in sideways markets, we want the volatility to be as high as possible. The higher, the better.
### Volume
Volume is simply the number of shares traded in a particular stock, index, or other investment over a specifc period of time.
Considering we want a lot of movement in our charts, we want the Volume metric to be as high as possible or "trending".
### Close : EMA
EMAs can be used to decipher whether something is bullish or bearish. The indicator uses an 200 EMA for this metric.
If you are taking long trades, you want the close to be above.\
\
If you are taking short trades, you want the close to be below.
### Machine Learning
The value will update in real-time and will have a corresponding color depending on if it's bullish, bearish, or consolidating.
Dark Green => 75% and up
Green => 50% and up
Light Green => 25% and up
LightRed => -25% and below
Red => -50% and below
Dark Red => -75% and below
{% hint style="info" %}
Note: It's going to be very rare to have all the metrics be exactly what you want them to be. You should strive to have them all in their "optimal" state, but just know, in most cases, you will not be able to get every single metric perfect.
{% endhint %}
# Market Consensus
We added a feature that will directly affect the indicator's buy/sell signals based on the current market sentiment. For example, if you think the market is very bearish this week because of a war breaking out, high inflation rates, bad economic news, etc. You would set the market consensus to "Very bearish". This will directly affect the buy/sell signals of the indicator and give you a larger % of short trades compared to long trades. Making the indicator more accurate for the upcoming bearish pressure.
You can do the same thing with long trades. If there is bullish news, you would set the indicator's market consensus to "very bullish". This would give you more long trades, than short trades.
### How To Tell What The Current Market Sentiment Is?
There are plenty of ways you can check to see if the overall market sentiment is bullish or bearish. My favorite way of doing this is by checking [FinFiz.](https://finviz.com/?a=486183327) They have some great features to tell if the market is overall bearish or bullish. You can use these statistics/data to make the indicator even more accurate!
# TradingLab Indicator Videos
### Smart Money Concepts
Smart Money Concepts. One of the best-performing strategies I've found yet. In this video, I go over exactly how I use these strategies myself, on a day-to-day basis.
{% embed url="" %}
### Machine Learning
I finally dove into the world of machine learning and I couldn't be happier with the outcome. The possibilities are endless and I'm extremely excited to see what the future brings.
{% embed url="" %}
### OrderBlocks
I've created an extremely powerful institution order block indicator. It accurately tells you high points of interest for both buying and selling. It's honestly probably one of the best tools I've made to date. Excited to share it with you guys!
{% embed url="" %}
## How To Avoid Consolidating Markets
In this video, you will learn how to avoid consolidating markets. Choppy markets are never fun. They are extremely hard to predict and can oftentimes lead to losing trades. So, we should really try to avoid them at all costs. By watching this video, you will learn all of my secret techniques on how I avoid ranging markets.
{% embed url="" %}
### Breakout Probability Tool
The breakout probability tool is a fantastic weapon to have in your arsenal. If used correctly, it's an absolute game-changer. You really have to use it for yourself to see the power of this thing.
{% embed url="" %}
### Fair Value Gaps & Liquidity Grabs
Fair value gaps and liquidity grabs are a must-know tactic to see how the market is structured. Would definitely recommend watching this video to get a more in-depth look at how you can use the indicator to predict large trends.
{% embed url="" %}
### Supply and Demand
Supply and demand is one of the most important trading tactics to understand. In this video, I display how I personally find my zones, how I enter, how I exit, and I also share some secret tricks I use to make my zones more accurate.
{% embed url="" %}
### General Overview of The Indicator
The video is a general overview of the indicator. The indicator has upgraded a lot since this video has been posted, but there is still a lot of value information in it. Would definitely recommend watching.
{% embed url="" %}
# Recommended Brokers
There are numerous brokers, certain ones specializing in stocks, others on forex and crypto. Below is a list of brokers that we recommend to our users.
## Forex
### [HankoTrade](https://login.hankotrade.com/register?franchiseLead=MjQxNg==)

HankoTrade has extremely low fees and costs compared to other Forex brokers. They also have a great support team. They also do a 100% matching bonus for whenever you first deposit. Great choice if you need a Forex broker.
## Crypto
### [ByBit](https://partner.bybit.com/b/TradingLab)

If you are from one of the allowed countries, ByBit is a great choice. They have low fees, big selection of coins to choose from, and they have a lot of bonuses for signing up.
### [Kraken](https://kraken.pxf.io/c/3466491/687155/10583)
If you are from the United States, Kraken is a great choice. They have a pretty decent selection of coins. The one downside is that they don't offer margin.
## Stocks
### [Webull](https://a.webull.com/i/TradingLab)

Webull has a great user-friendly platform. You also get $34 in FREE stock if you deposit $100 or more.
### [Charles Schwab](https://www.schwab.com/client-referral?refrid=REFERAAPF7ZPN)
I've used Charles Schwab before and actually liked it a lot. They have a really great user-friendly trading portal and you can also get level II data for free.
# Level II Data
This is more of an advanced trading topic, but if you want to take your trading to the next level, it's an important tool to understand.
Level 2 provides users with depth of price information, including all the available prices that market makers and electronic communication networks (ECN) post.
Level 1 offers enough information to satisfy the needs of most investors, providing the inside or best bid and ask prices. However, active traders often prefer Level 2 because it displays the Supply & demand of the price levels beyond or outside of the bid. This gives the user a visual display of the price range and associated liquidity at each price level.
Price movement on Level 2 is not necessarily an actual reflection of the recorded trades; Level 2 is just a display of the available price and liquidity. This is an important distinction because high-frequency trading programs frequently adjust Level 2 bid and ask prices violently to shake the trees and panic onlookers despite the lack of actual executed trades. This practice is common in momentum stocks.
Watch this video to get a better understanding of how to read Level II data:
{% embed url="" %}
# Best Time To Trade
It is always important to consider volatility in the market before trading. In other words, you want other traders actively taking trades in the market in order to have large fluctuations and movements. If there is low volatility then the market will consolidate or move "sideways" thus not allowing the indicator to predict moves as easily. Volatility is normally found during times when markets first open.
Let's cover the best times to trade in specifc markets.
## Best times to trade (FOREX)
The market open and market close will have the highest amount of volume & volatility. These are the times we want to target.
* Power Hours for FOREX occur when exchanges overlap. A great example is the overlap of London and New York exchanges which can cause large movements. (8-11 a.m. EST)
* Power hour is also considered the last hour of any exchange as many traders and institutions want their money out of the market before the exchange or trading day ends.
* Be careful getting into trades near the close of exchanges to avoid fees like Swap fees (swap fees only apply to MT4 traders). At night if you are trading with an MT4 Broker you will also experience higher spreads.
* \*It is important to remember that although exchanges are open for an extended period of time Volatility is important. Volatility or the amount of traders trading at a certain time varies. But, normally we know that the first few 2-3 hours of each trading session are highly volatile and are prime times to trade. The 1-2 hours at the end of a session can have surges of volatility as well.
## Best times to trade (US Stocks)
### Market Open
Usually the best time to trade stocks is the opening of the New York Stock Exchange at 9:30 AM EST.
Normally the open of the NY Exchange is VERY volatile and any pre-market analysis you have made can be completely invalid. It is very important to protect trades during high volatile times and practice before trading during this time.
### Lunch Hour
Lunch hour is from 11:30 AM EST to 2 PM EST. Usually, you want to **avoid** these times at all costs due to volatility going flat during these times.
### End of Day
The last 2 hours the market is open (2-4 PM EST) can be great times to trade as well. In fact, common intraday stock market patterns sho the last hour can be just like the first - sharp reversals and big moves, especially in the last several minutes of trading. during these times, day traders are often trying to close out their positions, or they may be attempting to join a late-day rally in the hope that the momentum will carry forward into the next trading day.
## Best times to trade (Crypto)
* Crypto currencies are one of the only markets that run 24/7, since it doesn’t rely on any central banking system or exchange that it needs to abide by.
* Crypto Currencies however do have higher volatility times even though it is open 24/7. We can find surges of movement when the larger exchanges are open like the London and New York exchange. We can find movement during the off hours of the market as well, but it is very important to not overtrade on markets that are open 24/7
# Timeframes
It is important to note that the TradingLab indicator works on **ALL** timeframes. With that said, some timeframes have a higher probability of working than others.
After all of our backtests, it seems higher timeframes, like the 3 hour, performed the best. This is because higher timeframes tend to have more weight and are easier to predict the direction of compared to smaller timeframes.
If you are a new trader, we recommend trading higher timeframes like the 1hr, 3hr, and daily. As it's easier to identify macro direction.
If you decide to use smaller timeframes, we recommend still checking the higher timeframes to see the general direction of the chart. This way, you know in the back of your head which signals you can add more weight to and trade with more clarity.
# Money Management
An important step in becoming a sucessful trader is a good money management strategy, this is crucial for trading more profitably. When you start trading, you can't simply start buying and selling securities using random position sizing or without having a precise risk/reward in mind. Money management will help you have control over the risk you are willing to take and will improve your capital lifetime.
## Position Sizing
The size of your position determines the number of contracts of a security you will purchase. There are various ways to size your positions, the best way being by taking into account your risk aversion. If you don't want to lose "*x"* percent of your capital you will then need to size your position accordingly.
You can determine the size of an investment based on the percentage of capital you are willing to risk, or base the size depending on if the market is volatile or not, using a lower position when the market is volatile to reduce risk.
You can also determine your position size by the TradingLab signals (Strong buy, Buy, Sell, Strong Sell). Putting higher %'s on strong signals compared to regular ones.
{% hint style="danger" %}
Don't use aggressive position sizing strategies such as martingales, which might make you lose all your initially invested capital in a short amount of time.
{% endhint %}
I'd recommend watching this video for money management advice:
{% embed url="" %}
### Position Sizing With The Kelly Formula
The Kelly formula is used to determine the percentage of capital you can use for your position size based on past performances and is calculated as follows:

Where $$K\times 100K×100$$ is the percentage of capital you can invest in a position, $$pp$$the probability of a win, and $$rr$$the ratio of win/losses. In order to get the probability of a win take a look at your past trades, and divide the number of winning trades by the total number of trades, this will give you$$pp$$. To calculate $$rr$$, divide the average gains by the average losses.
Note that this value can be negative, which implies that the average gains are lower than the average losses.
## Stop Loss
Stop losses help you protect yourself against variations opposite from the one you had anticipated, trading without a stop loss exposes yourself to potentially volatile variations that will significantly affect your capital.
In general stop losses are set at a specific price level, once the price reaches this level, your current position will be closed. Some platforms also allow you to set the distance between the price and your stop loss based on a value in pips, dollars, or percentages.
{% hint style="warning" %}
A stop loss will be filled once it triggers, but this does not necessarily mean it will be filled at the price it was set! As such you might have additional losses you were not expecting.
{% endhint %}
### Where To Place A Stop loss?
I actually made a video on how to place the perfect stop loss. I would highly recommend watching this, as it could help you from getting stopped out.
{% embed url="" %}
## Take Profits
Taking profit is just as important as stop losses. You should be taking profit at key resistances levels on the chart. Whether that is a resistance on a higher time frame, fair value gaps, baseline changing color, or the indicator giving you a take profit signal.
# Trading Psychology
* Trade with discretionary money (DO NOT TRADE WITH MONEY YOU ARE NOT WILLING TO LOSE)
* Prepare for some losing trades. No strategy is perfect.
* Never go live until you are successful and comfortable with demo trading.
* Continue to practice strategies with demo trading after you go live
* Realize you don't need to be trading 100% of the time. There will be days when you shouldn't enter a trade.
* Set an attainable goal and then quit for the day.
* Trading is not a get-rich-quick scheme, take time to learn and practice. It's a marathon, not a race.
* Have an exit strategy that you will use with real money
* Don't let trades pass you by because you're overanalyzing a Chart
* Be prepared for announcements and news at any time
* Keep your trading plan simple
## Emotions
* Many skills are required for trading successfully in financial markets. They include the ability to evaluate a company's fundamentals and to determine the direction of a stock's trend. Neither of these technical skills are as important as the trader's mindset.
* Containing emotion, thinking quickly, and exercising discipline are key components you need to understand to become a succesful trader.
{% hint style="info" %}
There are two main emotions to understand & keep under control. Fear & Greed.
{% endhint %}
## Understanding Fear
* When traders see their position going in the opposite direction they want it to, they naturally get scared. They may overreact and feel compelled to liquidate their holdings or immediately take themselves out of trades, refraining from taking any more risks. If they do, they may avoid certain losses but will also miss out on potential gains.
* Traders need to understand what fear is: a natural reaction to a perceived threat. In this case, it's a threat of losing their hard-earned cash.
* Quantifying the fear might help. Traders should consider just what they are afraid of, and why they are afraid of it. But that thinking should occur before the bad news, not in the middle of it.
* By thinking it through ahead of time, traders will know how they perceive events instinctively and react to them, and can move past the emotional response. Of course, this is not easy, but it's necessary to the health of an investor's portfolio, not to mention the investor.
{% hint style="info" %}
Before entering a trade, you should already plan for all outcomes (both up & down). This way, you will have fewer emotions during live sessions, as you already planned for that specific outcome.
{% endhint %}
## Overcoming Greed
* There's an old saying on Wall Street that "pigs get slaughtered." This refers to the habit greedy investors have of hanging on to a winning position too long to get every last tick upward in price. Sooner or later, the trend reverses and the greedy get caught.
* Greed is not easy to overcome. It's often based on the instinct to do better, to get just that little bit more. A trader should learn to recognize this instinct and develop a trading plan based on rational thinking, not whims or instincts.
{% hint style="info" %}
Have a clear take profit point. Wheter that's the indicator giving you a take profit mark, a certain resistance, or a risk to reward ratio. Whatever it is, stick with it and don't change it.
{% endhint %}
## Setting Rules and Following your trading Routine/Strategy:
A trader needs to create rules and follow them when the psychological crunch comes. Set out guidelines based on your risk-reward tolerance for when to enter a trade and when to exit it. Set a profit target and put a stop loss in place to take emotion out of the process.
{% hint style="danger" %}
REMEMBER! If you truly have tested a certain strategy for months and know it has a 75% winrate (for example), emotionally and mentally you need to remember that you will have a loss 25% of the time. This is completely fine since you know that 75% of the time it will be a winning trade and as long as you are using correct risk management, you will be profitable in the end. Thinking like this will keep your emotions in check.
{% endhint %}
# Divergences
### What Is A Divergence?
Divergence is when the price of an asset is moving in the opposite direction of a technical indicator, such as RSI, or is moving contrary to other data. Divergence warns that the current price trend may be weakening, and in some cases may lead to the price changing direction.
There is positive and negative divergences. Positive divergence indicates a move higher in the price of the asset is possible. Negative divergence signals that a move lower in the asset is possible.
* Divergence can occur between the price of an asset and almost any technical or fundamental indicator or data. Though, divergence is typically used by technical traders when the price is moving in the opposite direction of a technical indicator.
* Positive divergence signals price could start moving higher soon. It occurs when the price is moving lower but a technical indicator is moving higher or showing bullish signals.
* Negative divergence points to lower prices in the future. It occurs when the price is moving higher but a technical indicator is moving lower or showing bearish signals.
* Divergence isn't to be relied on exclusively, as it doesn't provide timely trade signals. Divergence can last a long time without a price reversal occurring.
* Divergence is not present for all major price reversals, it is only present on some.
### What Does Divergence Tell You?
Divergence in technical analysis may signal a major positive or negative price move. A positive divergence occurs when the price of an asset makes a new low while an indicator, such as RSI, starts to climb. Conversely, a negative divergence is when the price makes a new high but the indicator being analyzed makes a lower high.
Traders use divergence to assess the underlying momentum in the price of an asset, and for assessing the likelihood of a price reversal. For example, investors can plot oscillators, like the Relative Strength Index (RSI), on a price chart. If the stock is rising and making new highs, ideally the RSI is reaching new highs as well. If the stock is making new highs, but the RSI starts making lower highs, this warns the price uptrend may be weakening. This is negative divergence. The trader can then determine if they want to exit the position or set a stop loss in case the price starts to decline.
Positive divergence is the opposite situation. Imagine the price of a stock is making new lows while the RSI makes higher lows with each swing in the stock price. Investors may conclude that the lower lows in the stock price are losing their downward momentum and a trend reversal may soon follow.
Divergence is one of the common uses of many technical indicators, primarily the oscillators.
### The Difference Between Divergence and Confirmation
Divergence is when the price and indicator are telling the trader different things. Confirmation is when the indicator and price, or multiple indicators, are telling the trader the same thing. Ideally, traders want confirmation to enter trades and while in trades. If the price is moving up, they want their indicators to signal that the price move is likely to continue.
### How To Use Divergence With The Indicator?
You can pair divergences with the buy and sell signals of the [TradingLab indicator](https://tradinglab.ai/). So for example a "buy" signal from the TradingLab indicator by itself is not a lot of confirmation. If you pair that "buy" signal with a bullish divergence, there is now a much stronger chance the trade will go in your favor.
I would recommend testing divergences out. They are everywhere! You will realize their true power once you start pairing them with the indicator.
# Common Trading Mistakes
Knowing what to do is important, but knowing what NOT to do is even more crucial. Common trading mistakes can stop you from becoming a successful trader and it's important you realize when you are making them (a lot easier said than done).
In this video, I go over some common mistakes that traders make. If I was a betting man, I'd say you are probably making one of these mistakes mentioned in this video:
{% embed url="" %}
# Support & Resistances
The concepts of trading level support and resistance are undoubtedly two of the most highly discussed attributes of technical analysis. Part of analyzing chart patterns, these terms are used by traders to refer to price levels on charts that tend to act as barriers, preventing the price of an asset from getting pushed in a certain direction.
At first, the explanation and idea behind identifying these levels seem easy, but as you'll find out, support and resistance can come in various forms, and the concept is more difficult to master than it first appears.
{% embed url="" %}
# 5 Step Strategy
### Strategy Download:
{% file src="/files/ER9rwiyUBn2oRjAPMfIC" %}
This strategy is how I made $70,536 in just 60 days of trading. \
\
I also go over this strategy in this video here:
{% embed url="" %}
# Trading Terminology
If you're interested in trading, you're likely familiar with some of the key terms that traders use. From buying and selling to market orders and limit orders, the language of trading can be complex and confusing. But understanding the terminology is crucial for successful trading.
### ADRs
* ADRs are American Depository Receipts for reign companies that trade in the US.
### Ask
* Ask, on the other hand, is what people selling stocks are looking to get for their shares.
### Authorized Shares
* This is the total number of shares that a company can trade. It’s always bigger than the public float.
### Averaging Down
* This is when investors buy more of a stock as the price goes down. This results in a decrease of the average price at which the investor purchased the stock.
### Bear Market
* A bear market is one in which investors expect stock prices to fall. This is where short sellers shine.
### Bearish
* In trading “bear” basically means your bias is “down” or “downtrending.”
### Beta
* A measurement of the relationship between the price of a stock and the movement of the whole market. If stock XYZ has a beta of 1.5, that means that for every 1 point move in the market, stock XYZ moves 1.5 points and vice versa.
### Bias
* Prejudice in favor of or against one thing. In trading, it is dangerous to have a bias that doesn’t agree with the trend.
### Bid
* Your bid is what you’re willing to pay for a stock.
### Bid-Ask Spread
* The bid-ask spread is the difference between what people have to spend and
what people want to get. The spread must be resolved before the transaction can take place.
### Blue Chip Stocks
* These are the large, industry-leading companies offering stable dividend payments.
### Broker
* A person who buys or sells an investment for you, in exchange for a fee.
### Bull Market
* A bull market is a market condition that means stock prices are expected to rise.
### Bullish
* In trading “bull” basically means your bias is “up” or “uptrending.”
### Buy
* Means to take a position or to buy shares in a company.
### Capitalization
* Market capitalization refers to what the market thinks a company’s value is.
### Chop
* Range-bound price action. Trend traders can get “chopped up” or “whipsawed” trying to jump on trends only to have them quickly fizzle out. When trend trading is important to avoid sideways chop and focus on entering sustained trends.
### Confluence
* A situation in which two or more things come together. For example, two buy or sell signals happen at the same time.
### Curve-fitting
* Fitting a strategy to the data at hand for the best possible outcome. In essence, producing a “overfit strategy” that doesn’t work outside of the single example it has been built on.
### Day Order
* Day Order means that your order is only good for the day when it’s placed.
### Day Trading
* The Practice of buying and selling within the same trading day, before the close of the markets on that day.
### Dividend
* This is a portion of a company’s earnings that is paid to shareholders, the people that own the company’s stock, on a quarterly or annual basis.
### Dogs of the Dow
* Dow Jones stocks that pay dividends; a traditional go-to choice for long-term investors.
### Drawdown
* The amount of a portfolio, fund, or position lost from one high point to the following low point. The performance of a strategy usually uses its max drawdown as a form of measurement.
### Equity Curve
* A graphical representation of your account balance over time.
### ETF
* ETF’s are exchange traded funds. They’re like stocks, because you buy and sell shares, but they’re also like mutual funds, because they track an index.
### Exchange
* An Exchange is a place in which different investments are traded. The most well-known in the United States are the New York Stock Exchange and the NASDAQ.
### Execution
* When an order to buy or sell has been completed. If you put in an order to sell 100 shares, this means that all 100 shares have been sold.
### Forex
* FOREX - or “Foreign Exchange” - involves trading different currencies.
### Fundamentals
* This is a very broad term and covers many different aspects but typically it refers to a company’s issuance, product launch, earnings, or impact of new regulations. This can also be interpreted as any metric used for measurement that is not the asset price alone.
### Going Long
* You’re betting that the company’s stock will increase in price so that you can buy low and sell high.
### Good till cancelled order:
* A GTC order means that your order stands until you cancel it and it will be executed whenever the stock comes to your price - even if that’s 2-3 weeks down the road.
### Hedge Funds/ Mutual Funds
* Hedge funds and mutual funds are two different types of investment accounts that you can buy into. They turn around and invest your money in dozens, hundred or even thousands of stocks.
### IPO
* An IPO is an initial price offering, which happens when a private company becomes a publicly-traded company, in order to raise money.
### Limit Order
* A limit order provides instruction to only execute at or under a purchase price or at or above a sale price. Always use limit orders, not market orders.
### Line of Best Fit
* Fitting a trendline to price action. Trying to find the line of best fit can lead to subjectively drawn trend lines that deviate from a standard ruleset, thus creating inconsistency with results.
### Liquidity
* Liquidity is how easily you can get into and out of a stock.
### Margin
* A margin account lets a person borrow money (Take Out A Loan) from a broker to purchase an investment. The difference between the amount of the loan and the price of the securities is called the margin.
### Market Order
* A Market order provides instruction to execute, as quickly as possible, a translation at the present, or market price. Don’t use market orders.
### Mean Reversion
* The belief that an asset’s price will return to its average despite upward and downward volatility (for example in a range-bound market).
### Momentum
* The rate at which price is accelerating compared to a previous period of time (example: “the momentum of the current candle compared to the last 14 candles is X”).
### Moving Average
* A stock’s average price-per-share during a specific period of time.
### Orderblock
* Order Blocks are created after price breaks away from a trend with momentum. They tend to mark market tops and bottoms; these levels often act as support and resistance later.
### Pennant
* A pattern formed by converging trendlines.
### Portfolio
* A collection of investments owned by an investor.
### Position Sizing
* The amount of trading capital committed to a single trade; mostly mentioned when referring to methods of managing risk.
### Probability
* The likelihood that something will occur. We can’t see the future, so we always try to consider situations based on probable outcomes.
### Public Float
* This is the number of shares that can actually trade, once shares that insiders (Like the company’s C-suite and early investors) Control are subtracted.
### Rally
* A rapid increase in general price level of the market or of the price of an individual stock.
### Range
* A place on the chart where price action has consolidated or is consolidating between a swing high and swing low.
### Range-bound
* Trading within a range.
### Resistance
* A level or range where price has seen reactions before and as such is likely to react again. This term refers to stock history as a predictor of future outcomes. Price must be below this area in order for it to be considered resistance.
### Risk management
* The process of limiting your losses to ensure capital preservation. The key to trading is achieving small consistent profits over time and not blowing up your account, even if you hit a losing streak. Most gurus and traders who brag about big gains generally aren’t using proper risk management, they will either have to change their style or will eventually lose it all (that or they are lying about their gains).
### Risk-to-Reward Ratio (R:R)
* The amount you can lose compared to the amount of possible gain from a single trade.
### Rule-Based System
* A repeatable set of criteria that if followed will result in predictable results.
### Sector
* A group of stocks that are in the same business. An example would be the “Technology Sector, including companies like Apple and Microsoft.
### Secondary Offering
* If a company’s stock is doing well, they may do another offering, in order to sell more stock and raise more money.
### Sell
* Getting rid of the shares that you purchased, either because you’ve achieved your goal or because you want to cut your losses.
### Shorting
* Opposite of going long, short selling involves **borrowing a security and selling it on the open market**. You then purchase it later at a lower price, pocketing the difference after repaying the initial loan.
### Stock Symbol
* A one to four Character alphabetic root symbol that represents a publicly traded company on a stock exchange.
### Stop Loss
* An order that usually, once triggered, the market sells an entire position at the best available price. Used to limit losses when a trade goes against you (the direction you did not expect).
### Support
* A level or range where price has seen reactions to before and such is likely to react again. Price must be above this area in order for it to be considered support.
### Support / Resistance Flip (S/R Flip)
* When previous support becomes resistance or previous resistance becomes support.
### Support and Resistance (S\&R)
* Levels or ranges that have been identified on the chart where price has done something noteworthy such as made multiple highs or lows, broken away from a range with momentum, seen a significant amount of trading volume, consistently reacted for some reason, or even more generally where there is an indication that there should be a reaction in the future based on past occurrences.
### Swing High
* A peak was reached before a notable decline in price.
### Swing Low
* A low was reached before a notable increase in price.
### Swing Trading
* A style of trading often referred to as obtaining gains over the course of multiple days, weeks or even months. Typically a trading style that is longer than day trading.
### Systematic
* Acting according to a fixed plan or system.
### Technicals
* The technicals refer to studying price action. Technical Analysis (TA) is studying charts at a technical and not at a fundamental level.
### Trade Setup
* A pre-planned and pre-evaluated trading plan with entry(s), exit(s), stop(s), that are decided before the trade is taken. This allows you to calculate risk / reward before you trade and build a trading plan.
### Trading Capital
* The amount of money you can have available to trade with.
### Trading Edge
* To have an advantage on the rest of the market. Traders often refer to this as to one of the main reasons they are profitable, or a large contributing factor.
### Trading Volume
* Trading volume is the number of shares being traded each day - a factor that has huge implications for a stock’s liquidity.
### Trend
* The direction of an asset’s price over a specific time period.
### Trend Line
* Connecting specific price points on a chart with a line to indicate the trend visually. An upper trendline is created by significant highs of price, a lower trendline is created by significant lows of price.
### Trend Trading
* Going long in an uptrend, short in a downtrend, and being flat when there is no trend.
### Volatility
* The process of measuring how much price is moving.
### Volatility
* Volatility is simply how fast a stock moves up and down.
### Win Rate
* The rate of wins to losses when trading.
### Quote:
* Information of a stock’s latest trading price. This is sometimes delayed by 20 minutes, unless you are using an actual broker trading platform.
### Yield
* This refers to the measure of the return on an investment that is received from the payment of a dividend.
In summary, trading terminology can be complex and confusing, but understanding the basics is crucial for successful trading. From buying and selling to market orders and limit orders, traders need to be able to communicate effectively to make informed decisions. By staying up-to-date on trading terminology and continually learning and growing as a trader, you can increase your chances of success in the market.
# Premium Membership
In the Discord we offer a premium membership where you get access to a bunch of private channels that the normal user does not have access to.
## Access Includes
### My Personal Trades

One of those channels is my personal trade alerts. Where I go over my entries, stop losses, and take profits. I will alert you whenever I take a trade and will also notify you of important news that's currently happening in the market.
### Other Features That Are Included With Premium:
* FREE Access to my private buy/sell indicator
* Access to the 🧪premium-chat where you can ask questions about your trades
* Access to my risk management course
* Access to my fundamental analysis Excel spreadsheet
* Access to my hot press keywords Excel Spreadsheet
* You will also receive access to all the Pro member rooms
### Sign up
If you're interested in signing up or want to see everything that comes with Premium membership, you can do so [here.](https://tradinglab.ai/premium/)


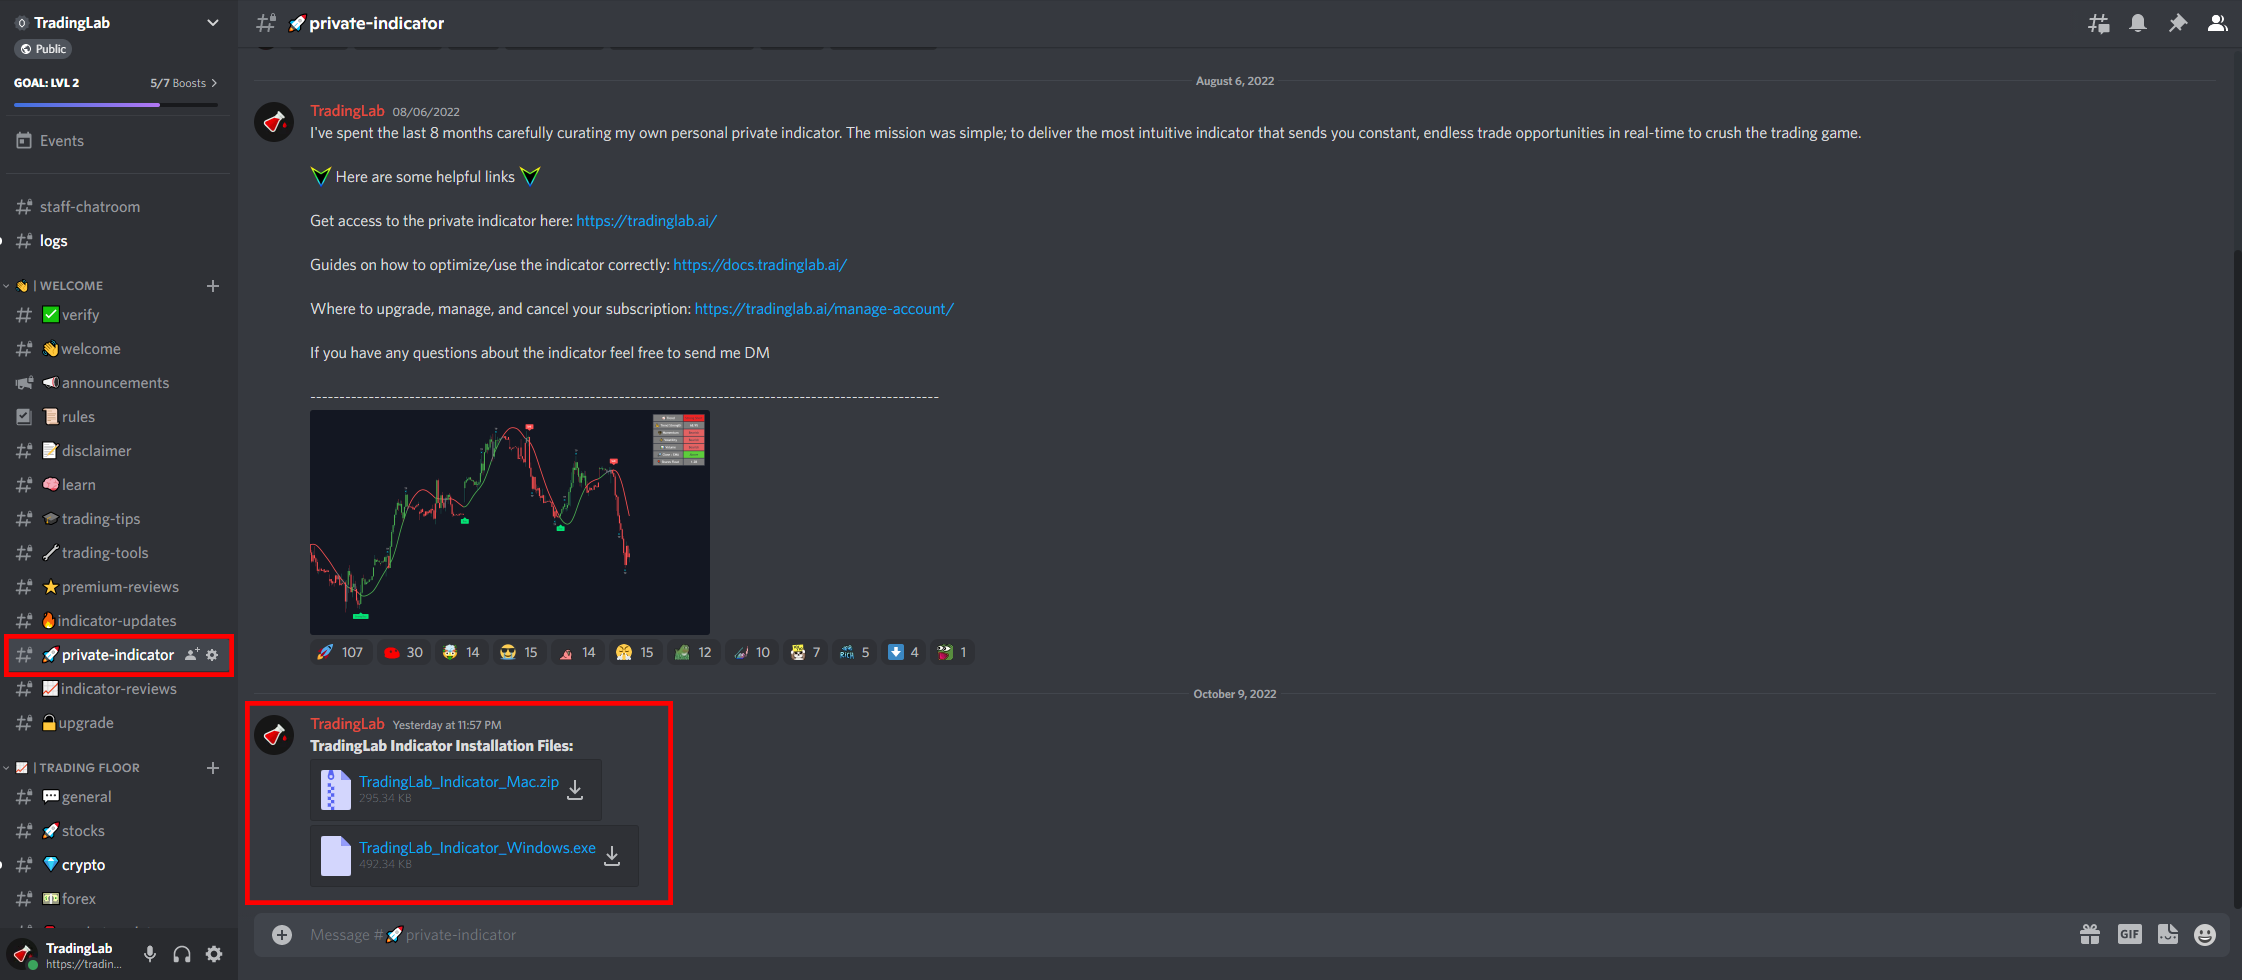


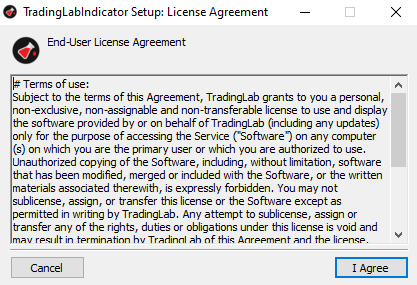


.gif?alt=media&token=85da037f-ded7-49d5-b93b-c50f2e1b865b)
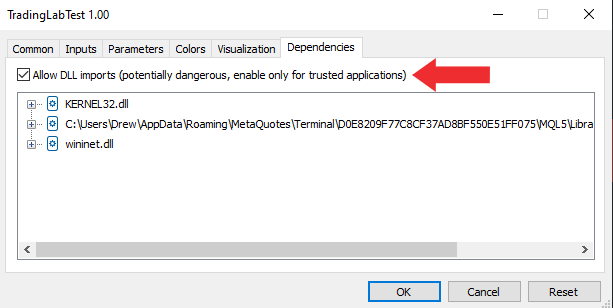
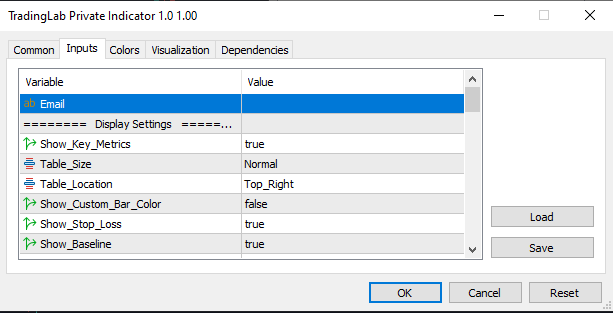


.png?alt=media&token=ebda47f9-a8a0-45eb-8680-b523edae6c76)
.png?alt=media&token=9c294e13-e553-4bfc-86ca-7b07094e4c6f)


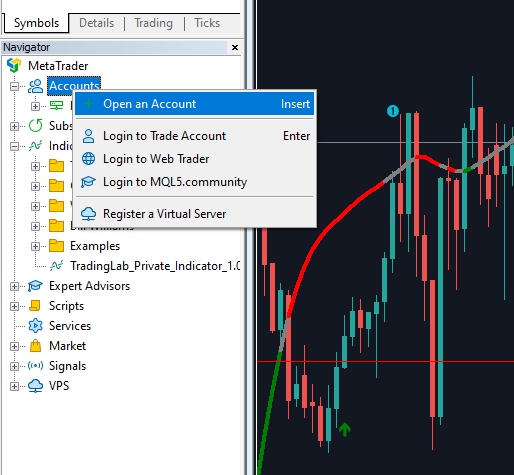


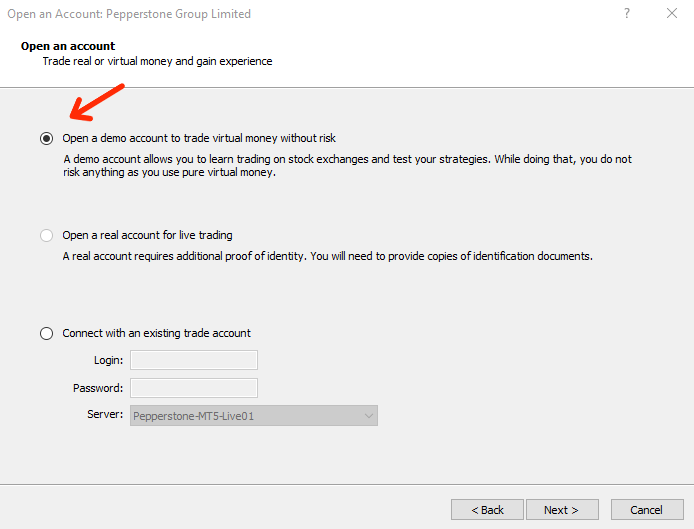


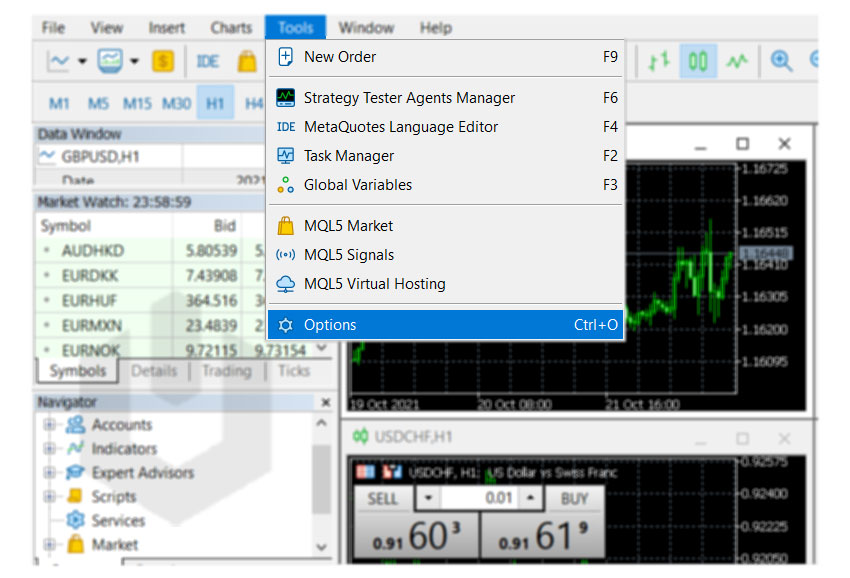

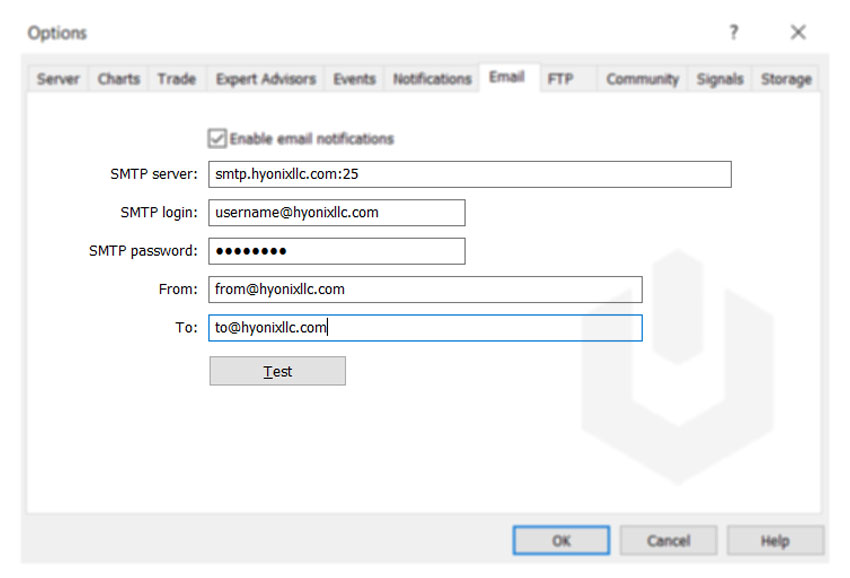
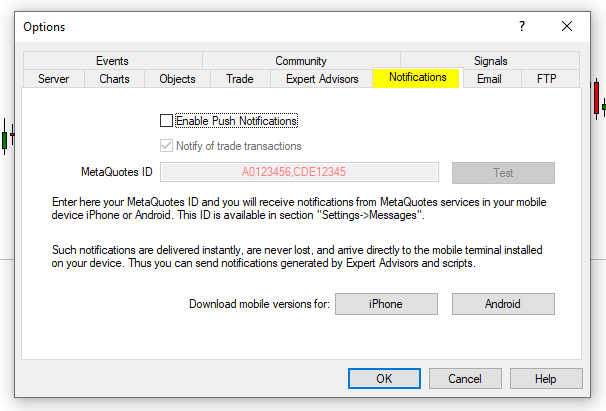

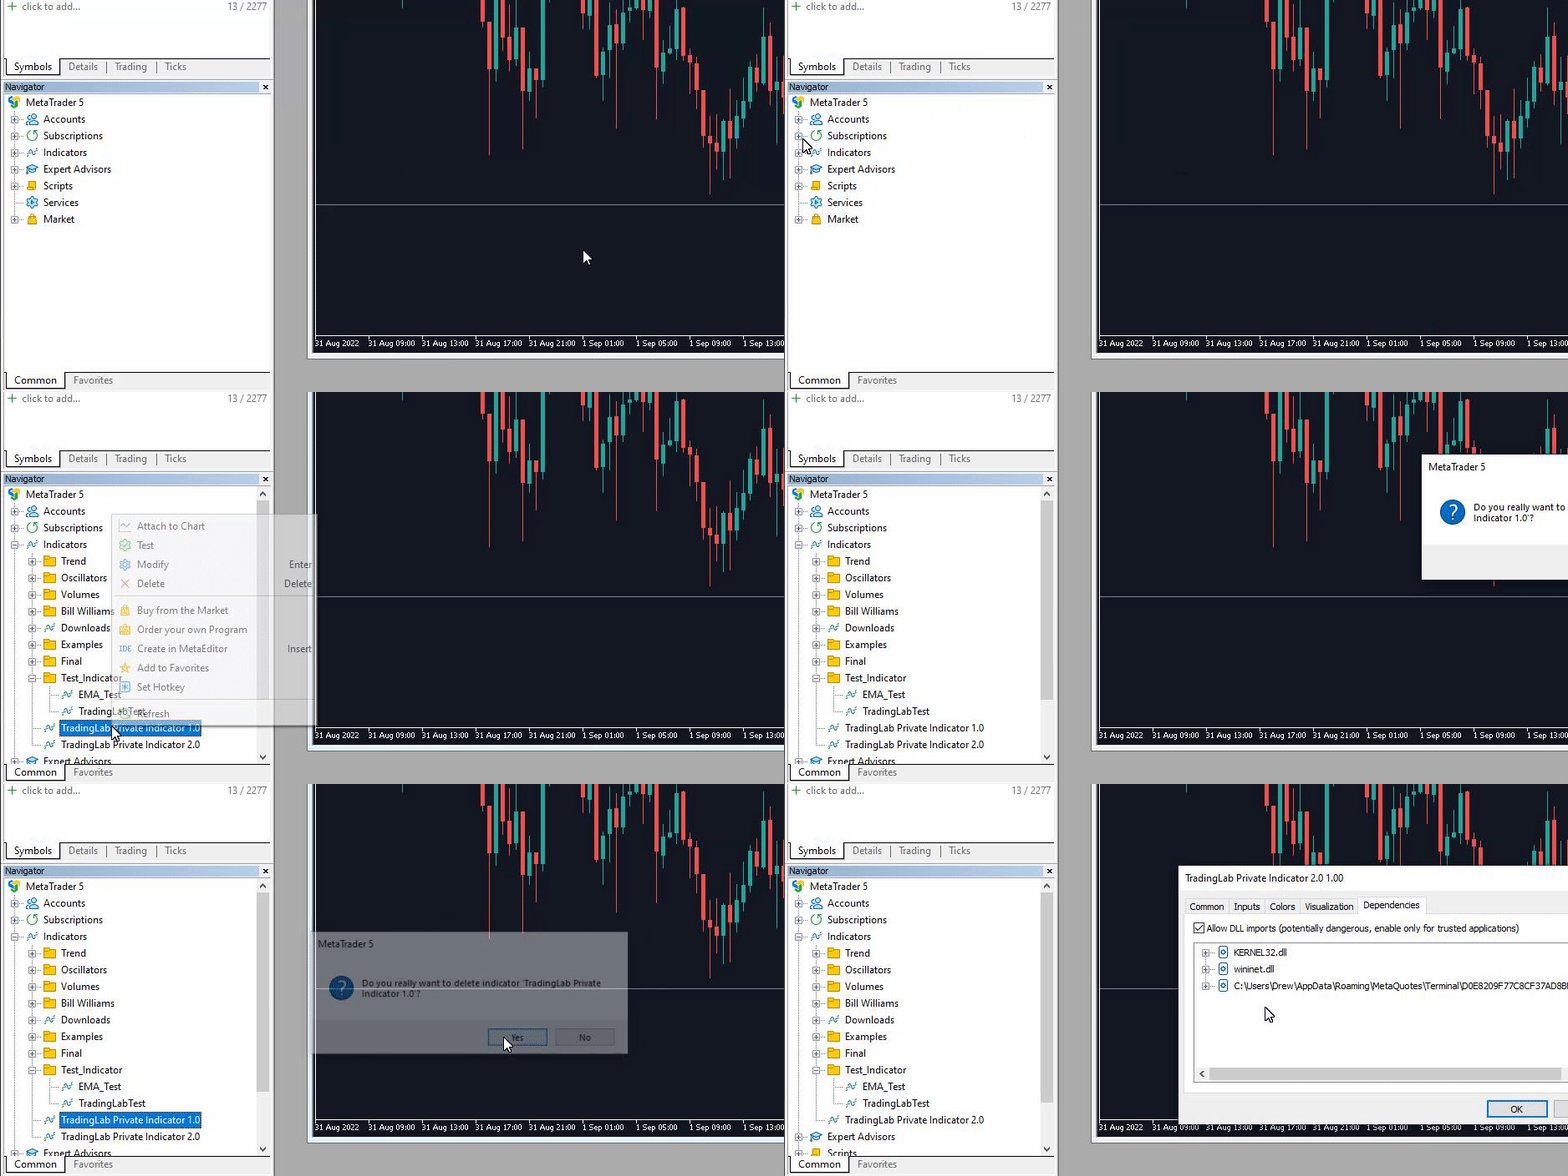


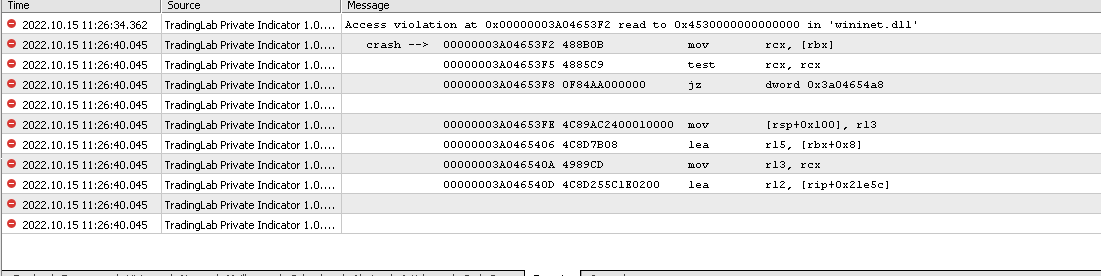


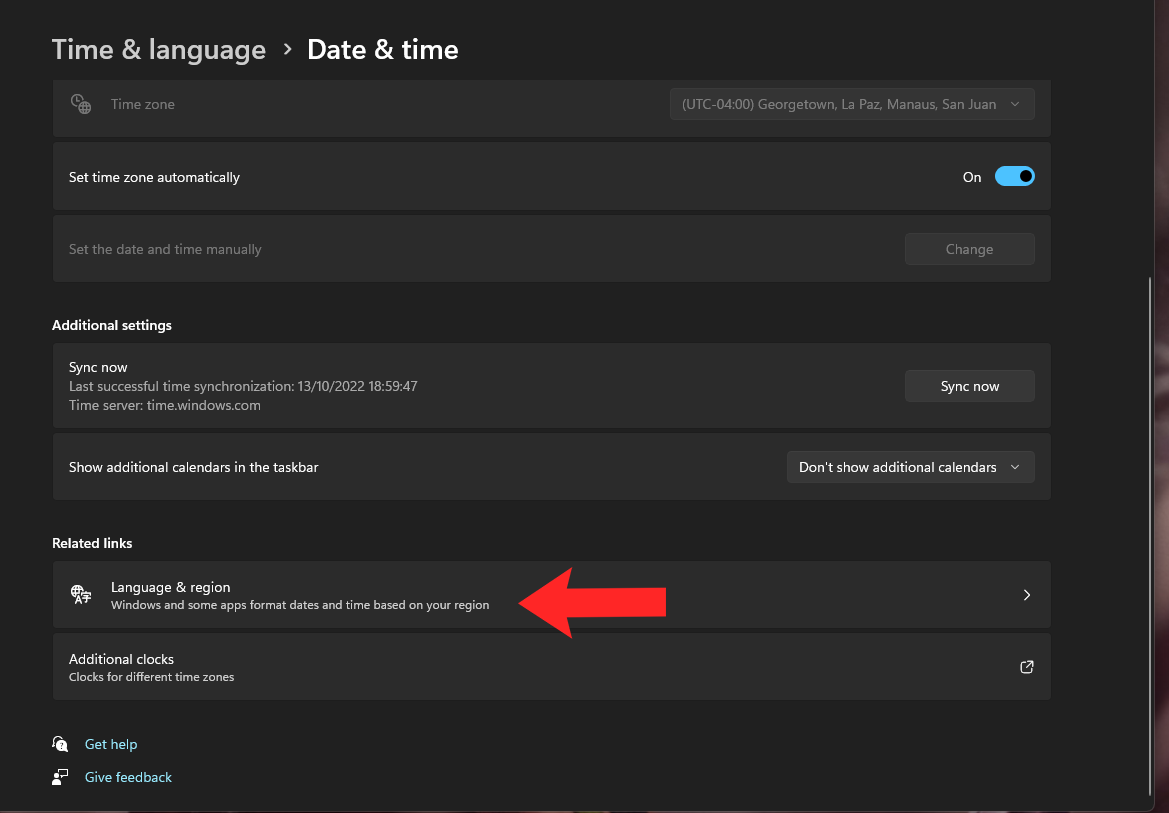


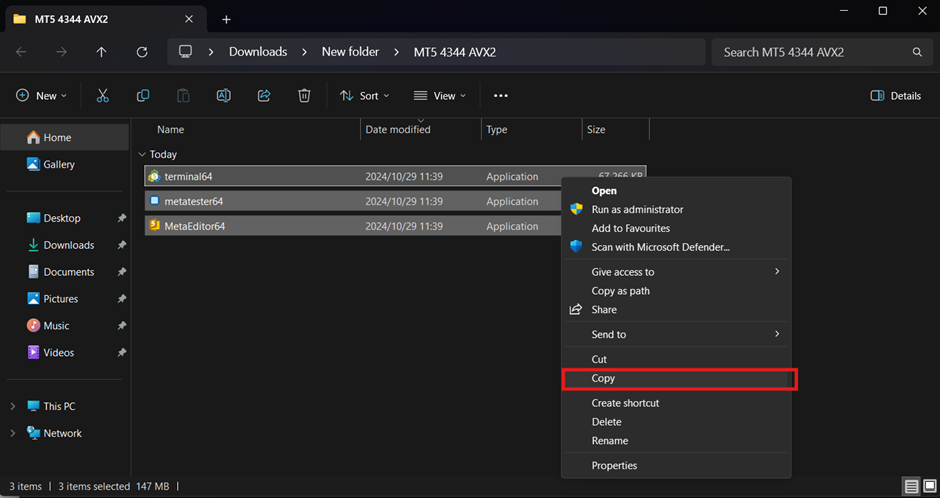
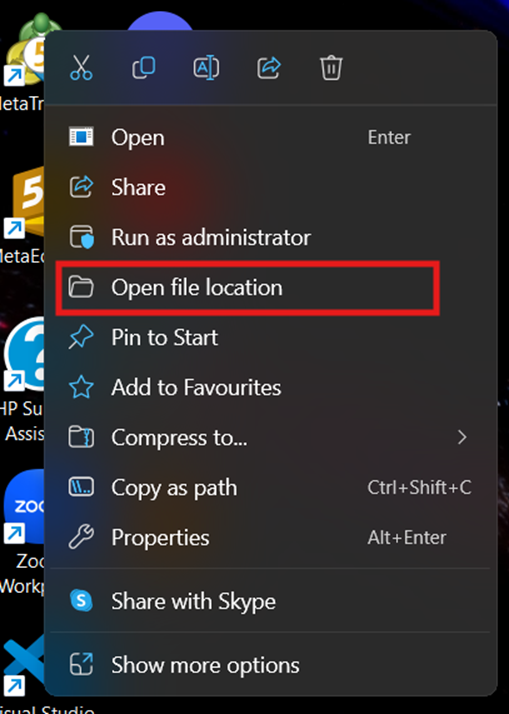


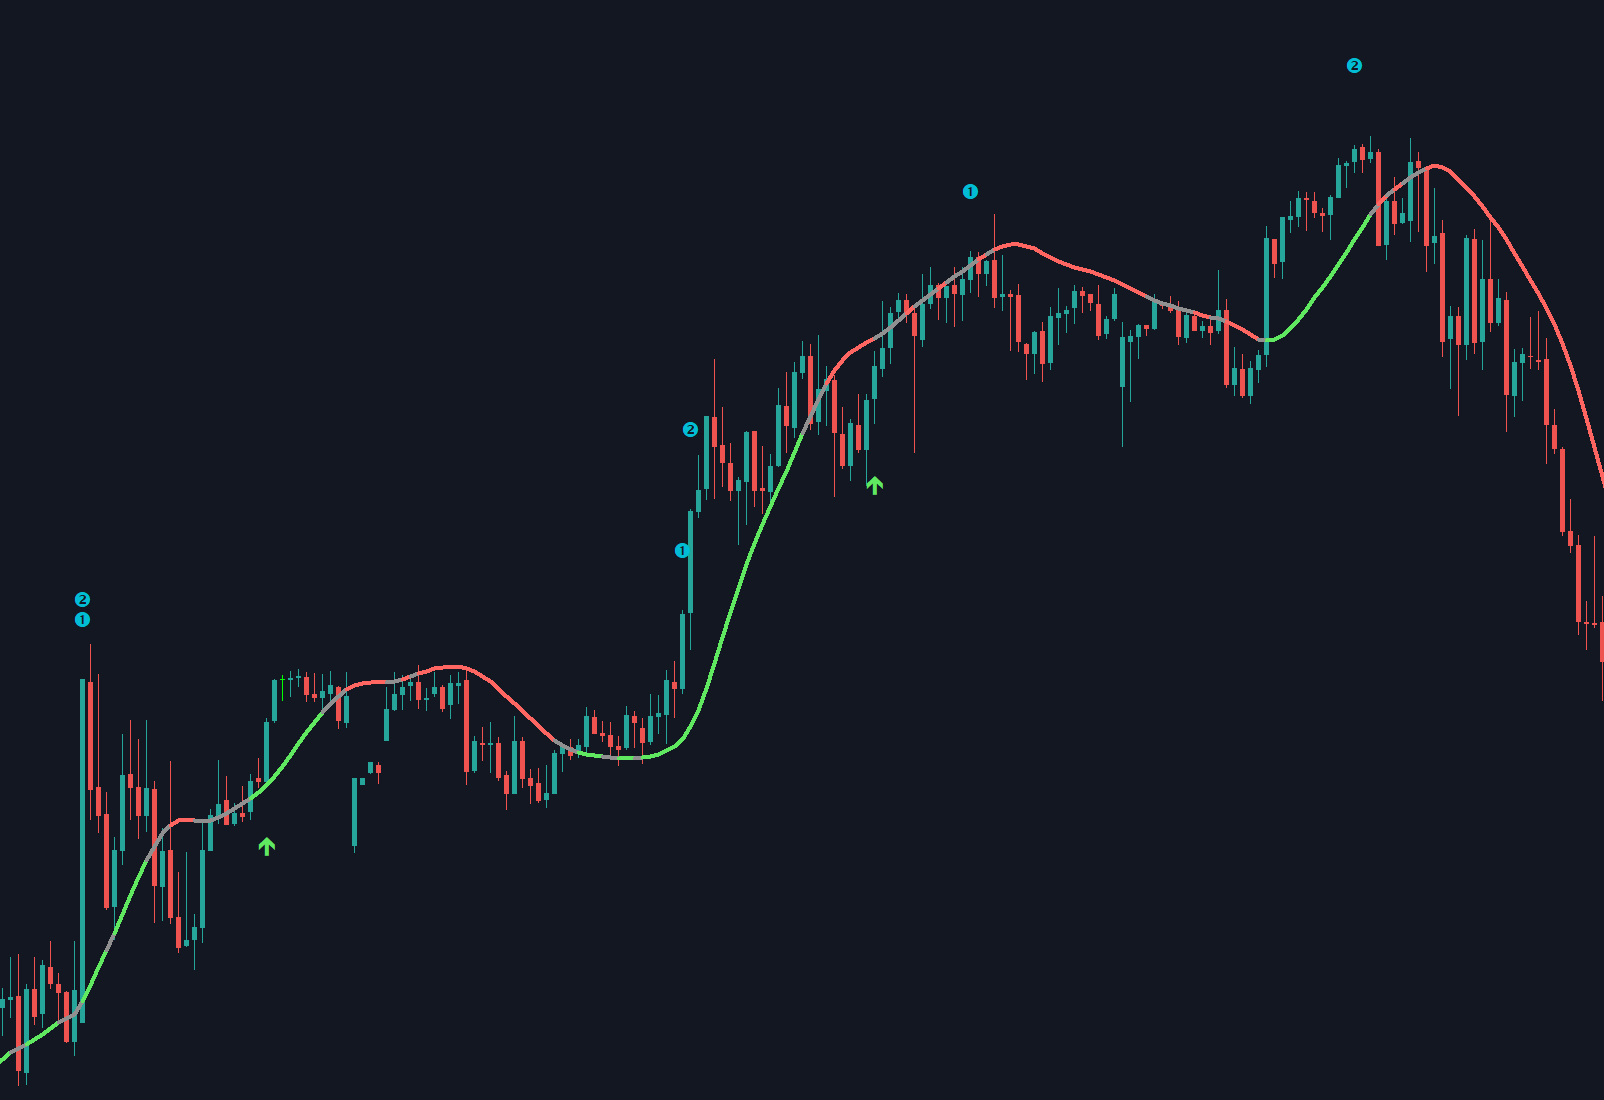


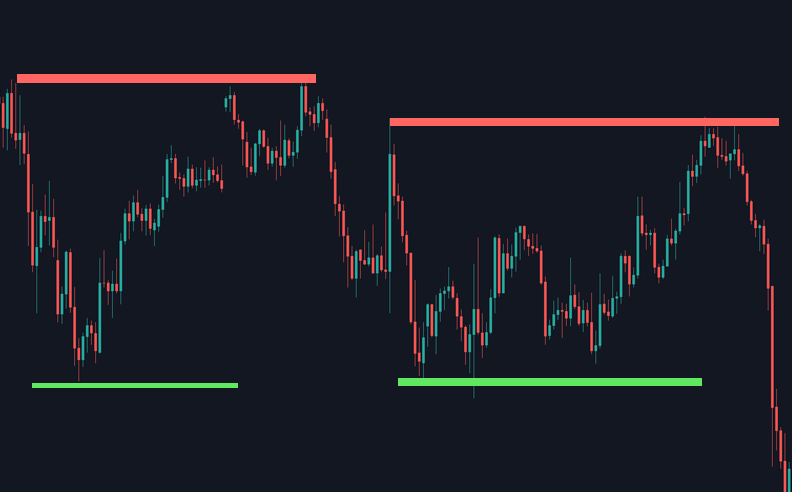


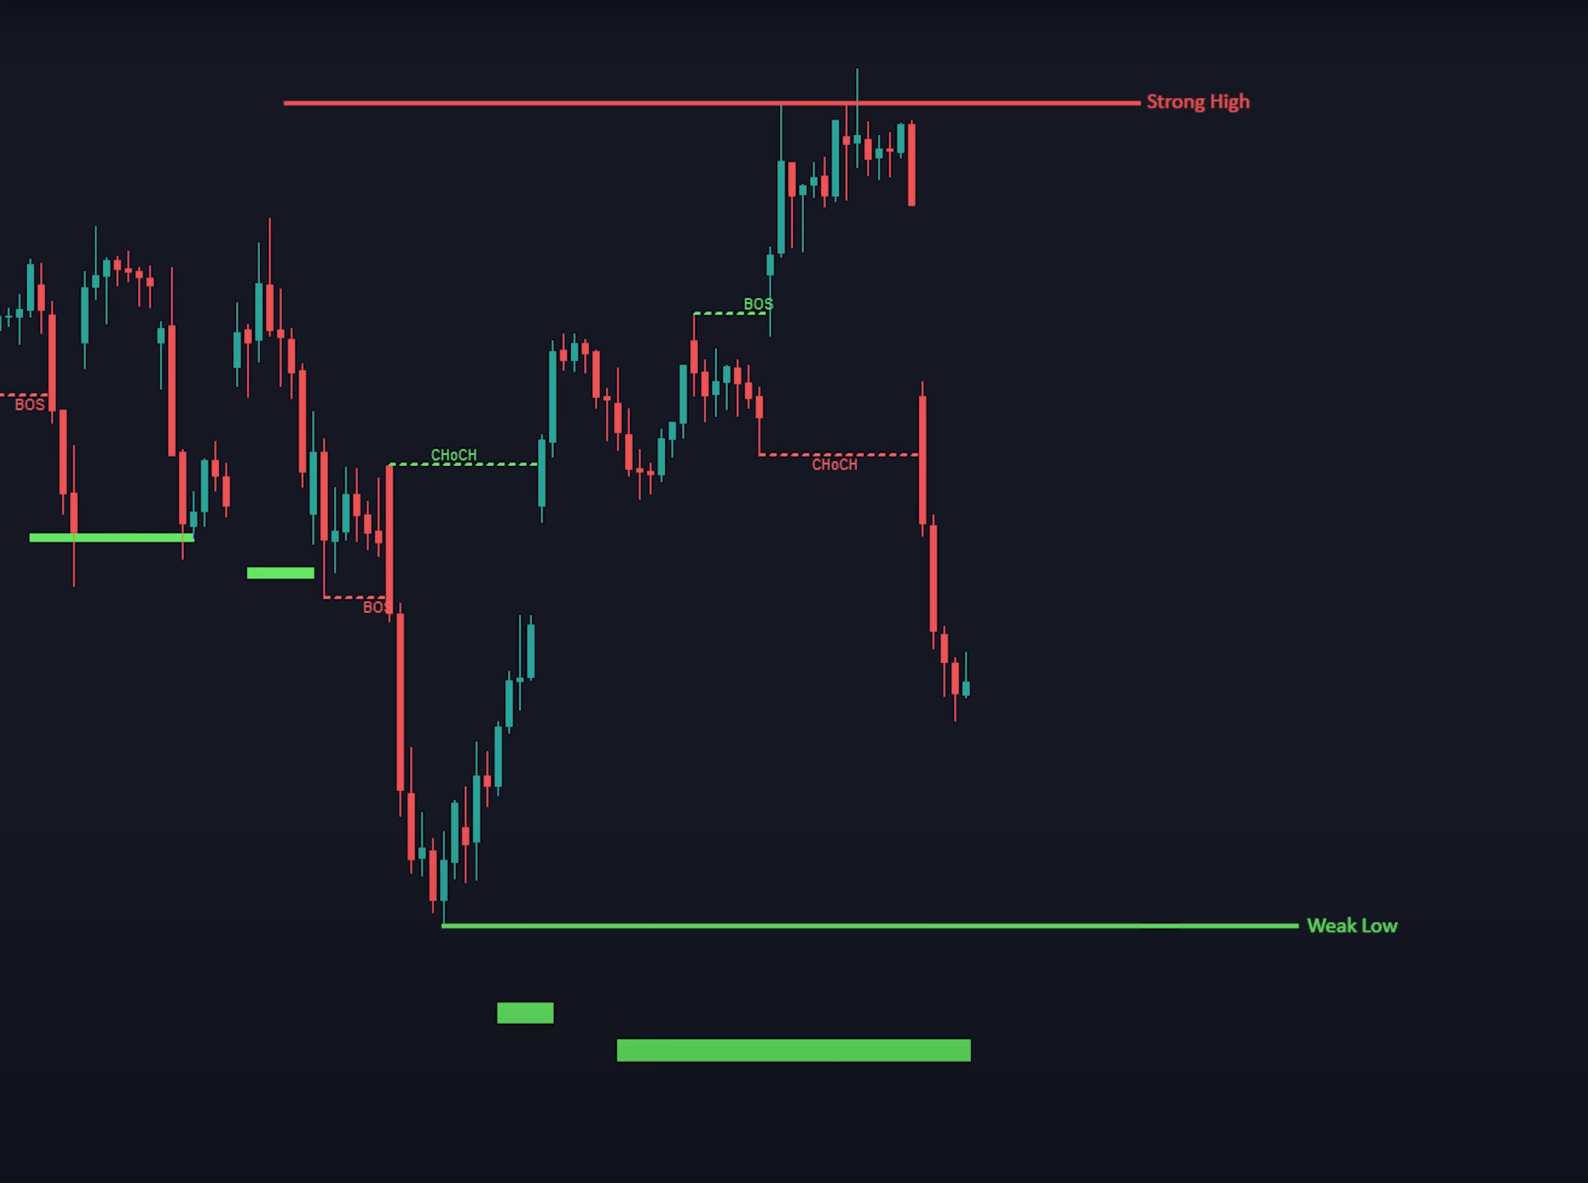


.png?alt=media&token=15b2a517-9254-48e8-99fe-2f3d88ee77c1)
.png?alt=media&token=4f828f51-f194-4f69-9beb-6d0edf19adb6)


